
Should students discover their own math lessons?
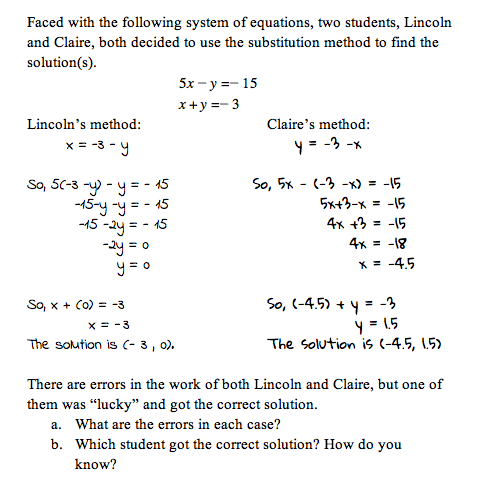
Example of a student-centered homework problem from the November 2014 AIR study.
Student-centered instruction is difficult jargon for lay people like myself to get their heads around, especially for a subject like mathematics. The idea, as I understand it, is to present students with questions, puzzles and scenarios and let them try to figure out the procedures for solving them, by themselves. A traditional teacher might simply explain, for example, how to graph a line, step-by-step, using y-intercept and slope. And a good traditional teacher can explain things in many ways and give students a tool box of procedures to tackle any problem. A student-centered teacher might turn the classroom floor into a giant graph-paper grid and ask the students to become data points and walk to where they should be plotted.
So which is better, a great teacher who explains things clearly, perhaps even with wit and humor, or a legendary teacher who takes a more Socratic approach and masterfully guides students to their own conclusions?
A team of researchers sought to answer exactly that question in a paper, “An Up-Close Look at Student-Centered Math Teaching and Its Effects on Learning: A Study of Highly Regarded High School Teachers and Their Students,” published on Nov. 18, 2014.

This article also appeared here.
Led by Kirk Walters of the American Institutes for Research (a quantitative research organization which also makes standardized tests for schools), the researchers found a group of 22 superb high school math teachers in New England and New York to study. Half were traditional teachers and half used many student-centered approaches. The conclusion of this small and imperfect study was that the more a teacher used student-centered approaches, the more his or her students learned, and the better they did on an exam of complex problem-solving that resembles the PISA international test for 15-year-olds, on which the United States has historically done poorly.
Related: Top US students fare poorly in international PISA test scores
“It was significant,” Walters said, explaining that, despite his small sample size of 22 teachers, the data showed bigger learning gains for the students who’d had student-centered instruction. Walters wasn’t able to quantify exactly how much better student outcomes were for each additional increment of student-centered instruction. So it’s unclear how large the benefits are.
Should all high school math teachers start adopting student-centered approaches? Walters categorically says, “No,”and he cautions against deriving big conclusions from this study, which may be the first attempt to look at whether student-centered instruction works for high school math. “This is one study that suggests student-centered approaches may hold promise,” he said. “For those who say that ‘discovery stuff’ doesn’t work or that it can’t be implemented properly, those arguments don’t fly anymore.”
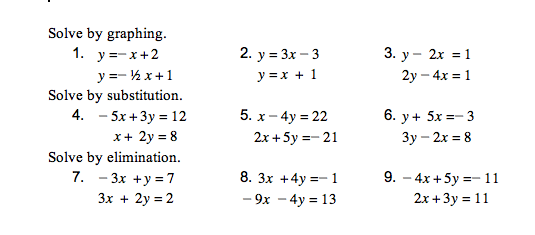
Example of traditional homework that reinforces rote procedures from the November 2014 AIR study
The main shortcoming of this study, besides its small size, is that the students in these teachers’ classrooms were mostly from middle-class households in six New England states and New York. They were far less ethnically and racially diverse than the nation. The students of these super teachers tended to be high performing students, scoring well above the national average on tests to begin with. Walters said student behavior wasn’t a problem for teachers in these classrooms. Interestingly, the researchers found that their group of 11 student-centered teachers had a higher proportion of poor students in their classrooms than the 11 traditional teachers did (36 percent qualifying for free or reduced price lunch vs. 24 percent).
Would student-centered approaches work with different populations of students in different types of schools? Does student-centered teaching work in a high poverty inner-city school where students are struggling and behind grade level? Those questions require further study.
Walters also says that further research is needed to understand when student-centered approaches are most effective. It may be that some concepts in mathematics, such as how to take a square root, are best taught through direct, traditional instruction. But other topics, such as solving a system of two equations, might be best taught through student-led inquiry. It’s also possible that student-centered approaches are appropriate for every topic, but not at every moment — for example, when introducing a new topic or when reinforcing one that has already been introduced.
This study purposely looked only at highly regarded, excellent teachers, so that you couldn’t criticize the study by saying, well, maybe these teachers didn’t do student-centered instruction properly. It’s a more challenging, indirect way of teaching. Previous studies have sometimes found that student-centered teaching didn’t work. For example, a 2014 Pennsylvania State University study found that student-centered approaches didn’t work for first graders who were behind and struggling. But it could have been that many of the teachers of these 14,000 students weren’t doing this method of teaching correctly.
Related: Right and wrong methods for teaching first graders who struggle with math
For high school math teachers, the most useful part of this study might be the case studies of great student-centered instruction. The authors were able to conduct classroom observations of seven of these 22 excellent teachers. From these, the researchers transcribed examples of student-centered classroom discussions and contrasted them with transcriptions of traditional discussions. They also printed examples of math problems that teachers gave students, to highlight how even homework can be traditional or student-centered.
It turns out that even teachers who think of themselves as student-centered don’t do it all the time. As Walters and his team observed classrooms, they found only one teacher who proved to be consistently student-centered throughout the year. Two teachers who considered themselves to be student-centered instructors often explained concepts the old-fashioned way, and the researchers ended up categorizing them in the middle between the two extremes. That caused Walters and his team to rethink their study’s design. Instead of categorizing teachers as strictly traditional or student-centered, they created a scale from traditional to student-centered and ranked teachers along the continuum.
It goes to show how difficult it is to study teaching approaches, and to figure out which ones work.
Three lessons from data on children’s reading habits

Renaissance Learning, “What Kids Are Reading And Why It Matters,” Nov. 2014
More than a decade ago a company called Renaissance Learning developed a computerized way for teachers to track students’ reading outside of the classroom. Instead of pasting stars on a chart each time a student says he has read a book, the teacher sits a student in front of a computer screen to answer a quiz on the book to prove he’s read it. The computer keeps track of how many and which books a student has read, along with the level of reading difficulty and whether a student has understood the basics of the story.
The program isn’t perfect; some students complain, for example, that a book they want to read from the library isn’t in Renaissance’s catalog of 165,000 book quizzes, and so it can’t be counted. But there are now almost 10 million students in the United States using the program, called Accelerated Reader, in more than 30,000 schools. It might be the biggest survey of reading in the country. This year, the director of educational research at Renaissance learning, Eric Stickney, mined the data, not just to see which books are the most popular*, but to gain insight into how kids become better readers as they progress from first grade through 12th. The company released the data from the 2013-14 school year — anonymized and aggregated to protect student privacy — on Nov. 18, 2014, and plans to make it an annual report. (Click on the “Why It Matters” tab to access the report).
This article also appeared here.
Caveats about the data: It’s not a nationally representative sample. More than a third of the children are from rural schools, whereas nationally, less than one fifth of students are in rural schools. So the tastes and habits of rural children are overstated. Otherwise, income and racial characteristics of the students come fairly close to the nation’s. Almost half of the students included in the data are poor, qualifying for free or reduced price lunch.
Here are three findings:
1. Girls read 800,000 more words
Girls read more books than boys do, in every grade, but boys aren’t that far behind girls from kindergarten through third grade. It’s beginning in fourth grade that reading habits really diverge by gender.
Starting in fourth grade, girls read, on average, 100,000 more words per year than boys do. Over the course of a child’s elementary, middle and high school education, that adds up to an almost 800,000-word difference (3.8 million words for girls vs. 3 million words for boys). The chart above shows the number of words that boys and girls, on average, read in each grade.
“It’s striking,” said Stickney, the research director at Renaissance. “It’s hard to learn new words when you’re not exposed to them, and girls are getting exposed to a lot more words.”
Stickney sees a strong connection between how much girls read and their higher scores on standardized reading tests. It might not be that girls are naturally better at reading, but that they simply do more of it, so they get better at learning vocabulary, for example, which is a big part of standardized reading assessments.
Thinking about the quantity of words absorbed reminds me of Betty Hart and Todd R. Risley’s early-childhood studies, which found that the more that parents or caregivers talked to a child from birth to age 3, the better off the child would be in school. These psychologists concluded that many low income children start school at a deficit because they haven’t heard as many words as high income children have. Perhaps the persistent female-male achievement gap on reading tests can be explained by these read (or unread) 800,000 words.
2. “The sweet spot” is 15 minutes a day
The good news is that the data also show that the more anyone reads, the more his or her reading ability improves over the course of a school year.
“Struggling students who read a lot have strong gains,” said Stickney.
A student who began the year in the bottom 25 percent of readers but proceeded to read for a half-hour a day and successfully answered quizzes on the books caught up with his class by the end of the year. In numerical terms, he jumped from 12th percentile to 48th percentile in one year. Admittedly, not a lot of students in this bottom category had this motivation — fewer than 25,000 students from the cohort of 10 million. But their growth was so strong, it outpaced the growth of advanced students who read just as much.
To be sure, mindlessly reading book after book doesn’t make you a scholar. Stickney found that comprehension was the key to the learning gains. For example, a child who read 30 minutes a day but answered fewer than 65 percent of the quiz questions correctly didn’t show strong improvement over the year. Indeed, this type of high-volume reader didn’t do any better than lazier students who didn’t bother reading much.
But a student who read between 15 and 30 minutes a day and answered 85 percent or more of the comprehension questions correctly scored 80 percent higher than his peers on a reading assessment in the spring. There wasn’t much additional benefit from exceeding a half hour of reading — only 3 more percentile points in achievement gains. The report calculates that 15 minutes of engaged reading time per day is “the sweet spot” for reading growth, after which students still benefit, but there are diminishing returns. Engaged time is not the same as clock time. The report estimates that a parent or teacher needs to schedule 35 minutes on the clock to achieve 25 minutes of engaged reading time.
The opportunity for a struggling student to surge ahead remained true for all the grades Stickney studied, from first through 12th. But Stickney did see larger gains from hard work in the earlier grades than in the older grades. For example, an elementary school student who read for a half-hour every day (and answered quiz questions correctly) tended to post a reading achievement growth rate that was 86 percent higher than that of his peers. The gains for these voracious readers fell to 70 percent in middle school and finally to 67 percent in high school. “Students, when they’re younger, tend to grow more in everything they do,” Stickney said. “The gains by year tend to be smaller as you get older.”
3. Supercharged learning
Which students showed higher rates of reading growth than everyone else? Stickney found accelerated growth for students who read challenging books that were above the students’ designated reading level. “These students really do grow,” he said. “They have even higher gains.”
But this supercharged growth occurred only when the student understood a majority of the book’s main points. The problem is that many students pick up a challenging book from time to time (about 12 percent of the 330 million books read on the Renaissance’s program were above the student’s designated reading level), but don’t comprehend it well. For these students, there was usually no benefit; they would have learned more had they embraced a book at their reading level.
So should a parent or teacher push a student to stretch and read a tough text? It depends. Stickney says it can’t hurt to give it a shot and see if the child can handle it. Some children are more inclined than others to look up a word in the dictionary. Perhaps a teacher can offer other comprehension strategies.
* If popularity lists are what interest you, you can use this search tool to see the top 10 books by grade, gender and state here.
Related: Three lessons from the science of how to teach writing and Right and wrong methods for teaching first graders who struggle with math
The sorry state of vocational training
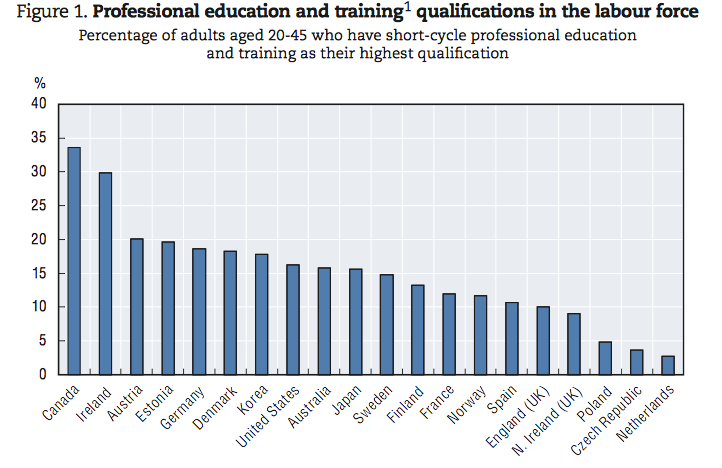
Source: OECD Skills Beyond School Synthesis Report Nov 2014. Click on the chart to see a larger version.
I had long been under the impression that the United States had a particular problem in providing technical and specialized professional training for students who maybe aren’t academically inclined. But it turns out the United States isn’t alone, and even nations with once vaunted apprenticeship programs are no longer properly training students to enter the workforce.
A new report finds that the vocational training programs in 20 economically developed countries aren’t producing enough students with the skills to be junior managers, health care technicians and other workers that the labor market needs. It says that two-thirds of all job growth in the European Union is forecast to be in the “technicians and associate professionals” category. In the United States, nearly one-third of job openings in 2018 will require some sort of professional training after high school, but not a four-year degree, according to the Nov. 13, 2014 report, “Skills Beyond School Synthesis Report,” by the Organization for Economic Cooperation and Development (OECD).
This article also appeared here.
Yet, in most countries, less than 20 percent of the labor force (aged 20 to 45) has a vocational certification. In the United States, only 12 percent of the labor force has a vocational certification. Another 10 percent has an associates degree; some of these degrees require applied career training, but many do not.
“Every county needs to upgrade,” said Stanley Litow, an IBM vice president who helped launch a new “P-Tech” model for vocational training in the United States. “Even the good apprenticeship programs are training for a narrow set of skills. Change is happening at a much faster pace. What we need are strong academics and workplace preparation that doesn’t prepare people for one job that doesn’t exist in the future.”
It’s interesting to consider this report in light of bleak employment prospects for some college graduates with four-year bachelor’s degrees. Many end up in low-paying jobs that don’t require expensive degrees. Perhaps some undergraduate students should consider obtaining a high quality technical certification instead. To be sure, many of the underemployed college students studied humanities and social sciences, such as sociology and psychology. Who knows if these students would enjoy a professional training program in, say, management.
The report documents how programs designed for the factory floor, such as manufacturing, engineering and construction, are falling out of favor across Europe and other developed nations. In Germany, enrollments in some specialties have fallen 50 percent. But a specialty known as “Fachwirt” — roughly akin to business administration, and commonly hired in health care and other service fields — has risen in popularity by 45 percent, and is now the most common advanced vocational exam taken. Still, vocational training is falling out of favor altogether among young Germans. The number of advanced vocational certification exams taken each year fell 24 percent from 1996 to 2010.
In the United States, health care is the most popular vocational field, accounting for 25 percent of the vocational degrees and certifications in the labor force, followed by engineering, manufacturing and construction. Teacher training is one of the least popular vocational subjects in North America and most of Europe, but it is very popular in Japan, Korea and Denmark. (Table 1.1 on page 31 of the report shows the breakdown for each country by speciality).
Data collection and analysis for vocational training is particularly difficult. Each country uses different labels and terminology. It’s a little-understood world of colleges, trade associations, diplomas, certificates and professional examinations without consistent standards. Vocational training is often lumped together with college or university education. Even to count the number of vocational degrees, researchers must tease out the numbers through statistical techniques and judgment calls. For example, some two-year degrees are more vocational in nature than others. U.S. students who complete vocational associates degrees make much more money than those who end their education with an academic associates degree, the report also notes.
The OECD authors argue that in order to enhance the image and status of vocational education, it should be uniformly renamed “professional education and training,” a term that is used in Switzerland.
But IBM’s Litow says that policy makers should focus more on revamping the content of vocational programs than on how they are labeled. “The problem is that vocational programs aren’t delivering,” he said. “We need to make large scale changes. I wouldn’t worry about what you call it.”
Litow hopes to expand his P-Tech model, which combines high school with two years of post-high school career training, including mentoring and internships, into nearly 100 schools by 2016. It began in 2011 as a pilot school in Brooklyn, N.Y., and is now in 27 schools across the country.
Related: Reflections on the underemployment of college graduates
Absenteeism: another way to measure school poverty
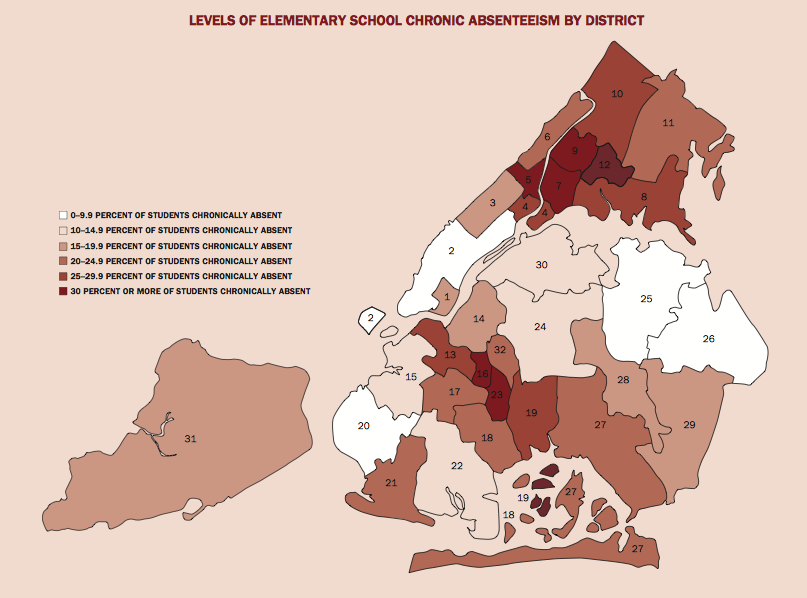
Map of New York City, showing neighborhoods with the highest rate of chronic absenteeism in the elementary schools. South Bronx and Central Brooklyn are shaded dark red. Center for New York City Affairs, The New School, November 2014 (Click on map to see a larger version)
How do you identify a bad elementary school?
A new report out of New York City suggests that policy makers should identify troubled schools by their absenteeism rates — a relatively easy data point to obtain — and then work to fix the schools by addressing each one’s unique problems, from homelessness and child abuse to teacher turnover and safety.
The report, “A Better Picture of Poverty: What Chronic Absenteeism and Risk Load Reveal About NYC’s Lowest-Income Elementary Schools,” released Nov. 6, 2014 by the Center for New York City Affairs at The New School, is part of a growing body of literature that argues that the poverty level of schools’ populations isn’t necessarily a good way to identify schools that need extra resources.
The study points out that 87,000 elementary school children, from kindergarteners to fifth-graders, missed more than 10 percent of the 2012-13 school year. Some schools were affected much more than others by this chronic absenteeism. The researchers found that, at 130 elementary schools, at least one-third of the students were chronically absent for five consecutive school years. It was even worse at 33 of these schools, where more than 40 percent of the student body missed more than 10 percent of the school year for five years straight. (In New York City, 10 percent of the 180-day school year is about 18 missed school days, almost a month of school).
This article also appeared here.
That affects not only the children who are missing school, but also the kids who are showing up. Teachers can’t move forward with new material when such a high percentage of children have missed earlier lessons and can’t keep up. The evidence is in the test scores: Only 11 percent of the students at schools with chronic absenteeism passed the city’s math and reading tests in 2012-13. Other schools with similar poverty levels but better attendance rates posted much higher test scores.
New York City Mayor Bill de Blasio took a different approach when he announced a new initiative on Nov. 3 to help a group of failing schools. The schools on de Blasio’s list were selected because their test scores had been stubbornly low for several years straight. His $150 million program plans to bring community services, such as social workers, psychiatric help and health care, into schools in poor neighborhoods. The program also involves lengthening the hours of the school day and expanding the school year to weekends and summertime.
The New School’s report’s list of the 35 elementary schools with the worst attendance problems includes nine from the de Blasio list, but the New School’s list of needy elementary schools is longer. “Maybe not all of these are the bottom of the barrel,” said Kim Nauer, the lead author of the New School report. “But I would argue that they deserve community school funds.”
Nauer found that schools with chronic absenteeism were likely to be beset by other poverty-related problems, such as male unemployment in the neighborhood and high rates of homelessness. But there was no common set of risk factors that applied to all the schools with chronic absenteeism. Her team created a “risk load” assessment, noting how much 18 different risk factors are affecting every public elementary school in the city. She hopes that this will help school leaders and community groups identify the support that each school needs. You can search her data by school here.
The New School Center has been documenting chronic absenteeism in New York City’s schools since 2008, when almost 29 percent of the city’s students were chronically absent. That declined to under 25 percent in 2012-13.
One school that has succeeded in combating chronic absenteeism is P.S. 48, an elementary school in South Jamaica, a poor neighborhood in Queens. Back in 2012, 160 of the school’s 550 students had been chronically absent. Principal Patricia Mitchell slashed that to about 20 students in 2013. Her school’s passing rate on the city’s standardized test more than doubled. Previously a social worker, Mitchell said she had paid home visits to understand why students weren’t coming to school. She learned, for example, that some parents weren’t getting to the laundromat often enough and didn’t want to send their kids to school in dirty uniforms. So she bought a washer and a dryer for the school and has school aides doing the laundry. She also holds regular parties to celebrate improvements in students’ attendance, replete with pizza, music, Macy’s gift cards and outings to Dave & Buster’s video arcade. “It’s like they won the lotto,” Mitchell said.
But not all schools that have reduced absenteeism have seen academic improvements. According to Nauer, a group of schools in the South Bronx hasn’t seen an improvement in test scores despite achieving better attendance figures. In the case of the Queens elementary school, it might be other things that Mitchell has done to improve the school that are raising student performance. That same year that attendance soared, Mitchell also won a $1.2 million grant from an outside foundation to bring in 15 community groups to help students and provide after-school enrichment programs. Not many high-needs schools have savvy administrators with the time and energy to write a successful grant proposal like that.
“Chronic absenteeism — it’s the signal,” said Nauer. “Then you need to fix the schools. You need to do detective work to figure out what’s going on. Each school is different.”
Related stories:
Lessons from Hawaii: tracking the right data to fix absenteeism
More than 6,000 charter schools now operate in the United States
The number of charter schools surpassed 6,000 at the start of the 2012-13 school year, as these schools — publicly financed, but privately run — steadily increased by 7 percent throughout the United States that year. This annual growth contributed to a 47 percent increase in the number of charter schools over the seven years since 2006-2007.
The charter school data came as part of a “first look” report of annual data collected by states and school districts for the federal government, and released by the National Center for Education Statistics on Thursday, October 30, 2014. The full 2012-13 Common Core of Data report, as it is called, is expected to be released later this year.
Still, at 6,079 schools in total, charters represented only 6 percent of the U.S. public school system of 98,454 elementary, middle and high schools.
Number of charter schools in each state during the 2012-13 school year
(Use arrows to navigate, then click on any state to see the numbers of charter schools from 2006 to 2013. Interactive map created by Jill Barshay of The Hechinger Report.)
Charters are unevenly spread throughout the country. The first interactive map above shows that California leads the country with more than a thousand charter schools. Texas is number two, with more than 600 charters, followed by Florida with more than 500.
This article also appeared here.
It’s interesting that charters have often become big political issues in states where relatively few charter schools operate. For example, in Connecticut — where controversies over charters have become part of this fall’s governor’s race — there are only 17 charter schools. Eight states — Alabama, Kentucky, Montana, Nebraska, North Dakota, South Dakota, Vermont and West Virginia — don’t allow charter schools to operate. Washington State didn’t either back in 2012-13, but its laws have since changed and its first charter school opened this past fall in 2014.
The federal government defines a charter school loosely as any school that provides free public elementary or secondary education under a charter. Typically, charter schools receive a per-pupil allotment of funds from the state or a local school district. Many charters supplement that with private fundraising. Most charters hire non-union teachers, but some have unionized faculty. Most charters operate independently of their local school districts and aren’t required to follow many of the district rules and regulations.
Charter growth rate in each state. Annual change between 2011-12 and 2012-13
(Use arrows to navigate, then click on any state to see charter growth from 2006 to 2013. Interactive map created by Jill Barshay of The Hechinger Report.)
Growth rates also have varied widely. In some states with an established charter movement, such as California, Florida and New York, there has been double-digit annual growth. In Texas and Louisiana, by contrast, growth is slowing. The biggest one-year increase in the number of charter schools was in New Hampshire, jumping from 15 to 22 schools, a 47 percent increase.
Charter school advocates (naturally) expect to continue seeing steady growth. The National Alliance for Public Charter Schools says that, when the data is released for the 2013-2014 year, it will show 600 new charter schools added that year and more than a 10 percent jump in student enrollment with 288,000 additional students attending charters. “It’s the largest increase we’ve seen in 14 years,” said Katherine Bathgate, director of communications and marketing at the advocacy group.
Bathgate says the waiting lists for seats in charter schools, which her group tracks, are growing longer even as the number of charter schools increase. If such demand continues, she predicts charter school growth will continue as well.
Growth in some states is tamped by laws that cap the number of charter schools. At the same time, other states are relaxing laws to permit more charters. For example, Mississippi recently changed laws that had made it very difficult for a charter to open. In Washington State, where charters are newly allowed, eight new charters are expected to open next fall 2015.
Additional charter school data, including the number of students enrolled, is expected to be released in November or December.
Correction: An earlier version of this column incorrectly stated that state lawmakers changed the law in Washington State, permitting charter schools to exist. The new law was approved directly by voters through a ballot initiative in November 2012. The text has been corrected.
Three lessons from the science of how to teach writing

What’s the best way to teach writing? The experts have many answers — and they often contradict each other.
In contrast to the thousands of studies on effective methods for teaching reading and mathematics, there are relatively few rigorous studies on writing instruction. That’s partly because it’s time-consuming and expensive to assess writing quality in a way that can be quantitatively measured. Commonly, researchers come up with an eight-point scale. They write descriptions and sample essays to show what each score involves. Then they train teams of graders to score properly and consistently. But writing quality is ultimately a subjective judgment. What you consider to be well-written, I might not.
Steve Graham, a professor of education at Arizona State University, has made a career out of monitoring research studies on teaching writing, to figure out which methods actually work. For a forthcoming article*, Graham and two colleagues, Karen Harris of ASU and Tanya Santangelo of Arcadia University, looked at approximately 250 of the most prominent studies on how to teach writing to students from kindergarten through 12th grade.
This article also appeared here.
Graham’s review of the research doesn’t resolve the age-old debate of whether students learn writing best naturally — just by doing it — or through explicit writing instruction.
But there are effective practices where the research is unequivocal. Distressingly, many teachers aren’t using them. “We have confirmation of things we know that work, but are not applied in the classroom,” said Graham.
Here are three:
1. Spend more time writing
To teach kids to write well, you need to ask them to write a lot. You’re not going to become a great basketball player unless you play a lot of basketball. The evidence is strong that this is true for writing too. Five studies of exceptional literacy teachers found that great teachers ask their students to write frequently. In nine separate experiments with students, 15 additional minutes of writing time a day in grades two through eight produced better writing. Seventy-eight percent of studies testing the impact of extra writing found that student’s writing quality improved.
Several studies found unexpected bonuses from extra writing time. Not only did writing quality improve, so did reading comprehension. Another cluster of studies proved that writing improves a students’ mastery of the subject; the act of writing helps you learn. (Another reason for teachers to refrain from spoon-feeding printed notes to students.)
However, surveys of U.S. teachers reveal that after third grade, very little time is spent writing in classrooms. In fourth through sixth grade, on average, 20-25 minutes a day is spent on writing, according to Graham. Writing assignments rarely extend beyond a page; sometimes they’re not more than a paragraph. This is what teachers self-report, and if anything they’re probably overstating how much writing they’re asking of students.
In a 2011 survey of classroom writing instruction, “A Snapshot of Writing Instruction in Middle Schools and High Schools,” published in English Journal, Arthur Applebee and Judith Langer at SUNY Albany found that U.S. students were expected to write only a total of 1.6 pages of extended prose for English a week, and another 2.1 pages for all their other subjects combined. Applebee and Langer also observed classrooms across the four core subjects (English, science, math and social science/history) and found that, on average, only 7.7 percent of classroom time was devoted to writing a paragraph or more. Applebee and Langer called that “distressingly low.”
Why so little writing? Graham hypothesizes that many English language arts teachers are more passionate about literature than teaching writing. But in surveys teachers often say they don’t assign more writing because they don’t have the time to read and provide feedback on frequent long assignments. I can sympathize with a high school English teacher who has 37 kids in her class.
One could argue that fewer high quality writing assignments might be better than a bunch of low quality ones. But again, the teacher surveys and classroom observations reveal that students are more commonly asked to write summaries. “We don’t see a high level of writing activities that involve analysis and interpretation,” said Graham. “We’re not seeing development of skills you need for college and the workplace.”
Common Core may change things, as the standards ask for more writing and analysis, not just in English class but also in the social sciences, hard sciences and math.
It’s unclear what the ideal amount of time for writing is. Graham, who wrote a teachers’ guide of evidence-based techniques for teaching writing for the What Works Clearinghouse unit of the Department of Education, recommends one hour a day. He admits he doesn’t have research to substantiate that number. But he may be onto something: When Poland increased its language arts classes to more than four hours a week for each student, its scores on international tests began to soar.
2. Write on a computer
In 83 percent of 30 studies on the use of word processing software, students’ writing quality improved when they wrote their papers on a computer instead of writing by hand. The impact was largest for middle school students, but younger students benefited, too. The theory is that students feel more free to edit their sentences because it’s so easy to delete, add and move text on a computer. The more editing, the better the final essay.
I was concerned about how these experiments were constructed. Could graders have been more biased toward these word-processor essays because typed fonts are more legible than hand-written ones? In most cases, the hand-written essays were retyped first before the graders scored them. So graders had no idea which essays had been drafted by computer and which by hand, and still the word-processor essays were rated higher.
It’s also possible that the spell checkers and grammar checkers that are sometimes bundled with word processing software enable students to submit cleaner drafts, which are perceived to be of higher quality.
Some educators feel passionately about the importance of writing by hand, convinced that the act of writing neurologically imprints stronger memories. And there’s some early evidence that note taking might be more effective by hand. But if your goal is writing quality and not memorization, it seems the evidence points to word processing, especially beginning in middle school.
Another benefit for educators who believe that students should write not just for teachers: computerized text files are easier to share with classmates, providing more opportunity for a real audience and feedback.
Despite this evidence,teacher observations and surveys reveal that teachers have been slow to adopt this basic technology. In Arthur Applebee and Judith Langer’s observations, students used word processing software in only 5.1 percent of the classes. Separate 2008 and 2010 surveys by Graham show that “too many schools still use pencil and paper as the primary or only writing medium,” he wrote.
3. Grammar instruction doesn’t work

This article also appeared here.
Traditional grammar instruction isn’t effective. Period. Six studies with children in grades three to seven showed that writing quality actually deteriorated when kids were taught grammar. That is, graders scored the essays of students who’d been taught traditional grammar lower than those of students who had not received the lessons.
Three studies did show that teaching kids how to combine two simple sentences into a single complex sentence was beneficial. (As a writer, I find that baffling as I am always trying to shorten my sentences! That makes me question the judgment of the essay graders.)
But traditional grammar — diagramming sentences or teaching grammar rules — didn’t help. Graham suspects that’s because grammar lessons often feel disconnected from actual writing. Graham found one study that showed great improvement in student writing quality when teachers modeled correct usage, showing how to use grammar rules in sentences that students were drafting. But not many experimental studies are looking at effective procedures for teaching grammar.
In this case, classroom practice isn’t totally at odds with the research. Grammar instruction has declined in U.S. classrooms over the last 40 years. But that might be because there isn’t much writing instruction going on at all.
* “Research-Based Practices and the Common Core: Meta-Analysis and Meta Synthesis,” (in press for The Elementary School Journal)
Related stories:
With new standards, can schools find room for creative writing?
Education Nation: Revived support for grammar instruction
Robo-readers aren’t as good as human readers — they’re better
Twenty five percent of low-income urban high schools beat the odds
This article also appeared here.
On average, low-income urban high schools with high concentrations of minority students sent about half, or 51 percent, of their 2013 graduates to college in the fall immediately following graduation. That could be either a two-year or a four-year college or university. By contrast, 70 percent of the students from high-income urban high schools with few minority students were enrolled in college in the fall. (Only high-income mostly white suburban high schools send more kids to college with 73 percent of the students enrolled in college in the fall).
But these averages mask big differences among public city high schools. This same data show that best 25 percent of the low-income, minority schools — about 130 high schools in the data sample — sent at least 60 percent of their 2013 graduates to college in the fall of 2013. The number was much higher at some. By contrast, the worst 25 percent of the high-income schools — about 60 of them — sent fewer than 60 percent of their graduates to college in the fall. (Low-income means that more than 50 percent of the students qualify for free and reduced price lunch. High minority means that more than 40 percent of the students are black and/or Latino).
“In every category of high school, there are clearly schools that are beating the odds,” said Doug Shapiro, director of the National Student Clearinghouse Research Center, which published the report, “High School Benchmarks 2014.”
This chart shows that 38 percent or fewer of the 2013 high school graduates from the bottom quarter of low-income high schools with high concentrations of minorities went to college in the fall of 2013. But among the top quarter of these low-income high schools, 60 percent or more of the students went to college in the fall.
It’s no surprise that some successful low-income schools would be doing much better than the average low-income school. And I wouldn’t be surprised to hear about a handful of low-income schools, perhaps small magnet schools that cream off the top students, that are doing as well as higher income schools. But what is surprising is that so many low-income schools — 25 percent of them — are doing better than so many of the higher-income schools. You wouldn’t expect such a big overlap, especially when the means for each group are 20 percentage points apart.
This data speaks to both sides of the debate on education reform. Those who says that income determines educational outcomes argue that you can’t reasonably ask schools to overcome a student’s family background. And they can point to the data here which show that students who attend higher income city high schools, on average, are 37 percent more likely to go straight to college than a student from a low income high school. Indeed, the fact that 75 percent of the high-income schools have more students going to college than 75 percent of the low-income schools is great evidence for those who say that income matters.
But the beating the odds data is music to the ears of the so-called school reformers who argue that better schools and teachers can get better student results. The fact that a quarter of the low-income schools are outperforming the high-income schools is exactly the kind of data that supports their cause. Interestingly, none of these are charter high schools. The National Student Clearinghouse excluded charters from the analysis because it was concerned that its charter school participants were too few to be nationally representative.
The National Student Clearinghouse isn’t revealing which high schools are outperforming or underperforming. But it hopes to publish the names of the high performing high schools in the future so that their practices can be studied and replicated. “Possibly next year,” said Afet Dundar, associate director of the National Student Clearinghouse Research Center.
While the National Student Clearinghouse is now tracking a giant data set of 3.5 million high school graduates from 2010 to 2013, a big shortcoming is that the data isn’t a nationally representative sample. It includes only student data from high schools who voluntarily participate in StudentTracker, a service that the National Student Clearinghouse markets to high schools so that they can see where their graduates end up. More than 3,000 high schools in all 50 states participate, covering 25 percent all high school graduates in the country. The participation rate is even higher in urban districts where 65 percent of the largest 100 districts participate, covering 40 percent of all urban high school graduates.The National Student Clearinghouse didn’t reveal which districts are or are not participating and so it is unclear how the missing high schools might be skewing the data.
Another shortcoming is that the data don’t give you a sense of how the students are faring in college. It does not reveal if the students are taking remedial classes, essentially repeating what they should have learned in high school. And we don’t have data yet on whether these students are eventually graduating from college.
This is the second year of the National Student Clearinghouse’s high school report and there aren’t enough years yet to show trends as to whether more kids are going to college than in the past. But it’s a welcome additional data point, beyond standardized test scores, to see which high schools are doing a good job.
New research suggests repeating elementary school grades — even kindergarten — is harmful
The already muddy research on whether it’s better to hold back struggling students or promote them to the next grade just got muddier. A new study ,“The Scarring Effects of Primary-Grade Retention? A Study of Cumulative Advantage in the Educational Career,” by Notre Dame sociologist Megan Andrew, published Sept. 26, 2014, in the journal Social Forces is an empirically solid analysis that adds more weight to those who say retention — what education wonks call repeating a grade — is ultimately harmful.
Andrew mined two large data sets in a way no researcher has done before and concludes that kids who repeat a year between kindergarten and fifth grade are 60 percent less likely to graduate high school than kids with similar backgrounds, and even 60 percent less likely to graduate high school than siblings in the same family.
Before I discuss Andrew’s paper in more detail, it’s helpful to understand some history. Most early research overstated how harmful it is to be held back a grade. It tended to point out that the struggling kids who repeat a grade don’t fare as well as kids who stay with their class, most of whom are not struggling. But that’s shoddy research. These studies didn’t compare the held-back kids with the kids who were also failing, but were promoted nonetheless.
Related story: Why Los Angeles sends failing students on to the next grade
This article also appeared here.
In data analysis terms, this early research conflated the bad effects being held back with the bad effects of the underlying issue that led a school (or a parent) to hold the child back in the first place. Consider a child who has trouble paying attention, can’t read by the end of fourth grade and is held back. Say, this child continues to get bad grades, tests poorly and eventually drops out of high school. Did the stigma of repeating fourth grade cause the child to become demoralized and to perform worse at school? Or was it his ongoing struggle with attention deficit disorder? If he had been promoted, would his academic career turned out differently? These early studies don’t say.
Even as the low quality research kept showing that holding kids back was bad, a growing chorus of critics urged schools to end “social promotion,” the practice of passing failing students onto the next grade. As my Hechinger Report colleague Molly Callister wrote here, 15 states and the District of Columbia have adopted policies requiring third-grade reading proficiency before a student can move to fourth grade. Two big cities, Chicago and New York City, undertook ambitious experiments in ending social promotion.
Those urban experiments attracted sophisticated researchers. Brian Jacob and Lars Lefgren studied students in Chicago, where the decision to hold a student back was based on a test score. The researchers were able to compare the experience of students who scored just below the threshold for passing with the experience of students who scored just above the threshold. Because of test measurement errors, these students were effectively testing at the same level — academically identical. But half were held back and half were promoted. In a 2009 paper, Jacob and Lefgren found that the harmful effects of retention largely melted away when comparing these two groups of students. Students held back in older grades still suffered a bit, but there was no decrease in high school graduation for students who’d been held back young. (Jacob, Brian A., and Lars Lefgren. 2009. “The Effect of Grade Retention on High School Completion.” American Economic Journal: Applied Economics, 1(3): 33-58.)
Four years later in 2013, a RAND study looking at New York City’s experiment with ending social promotion came to a similar conclusion — retention isn’t harmful. It also found that the kids who repeated fifth grade were better off than kids who just squeaked by and passed the test and moved on to sixth grade. (Study: “The Academic Effects of Summer Instruction and Retention in New York City.” Educational Evaluation and Policy Analysis, v. 35, no. 1, Mar. 2013, p. 96-117)
So a growing consensus was emerging in the research community that holding a kid back in younger grades isn’t harmful and sometimes helpful if accompanied by support services, such as summer school, tutoring and advising.
And now Andrew’s paper — contradicting the new consensus — lands. It’s a quantitatively rigorous study finding harmful effects for younger children. She looked at more than 37,000 children across the United States from two older multi-year surveys (NLSY 1979 and NELS 1988) and found that about 10 percent had been held back at school, most of them during the 1980s. The surveys included details of the family characteristics of the children. That allowed Andrew to create 6,500 matched pairs of students, where the retained and non-retained students had similar backgrounds. Their mothers had attained the same level of education and their families had the same household income. The students had scored the same on a pre-school cognitive test. (In layman’s terms, they started school with similar IQs). The matched students also had similar behavioral problems, as reported on the surveys. Home environment, gender and race were factored in, too. In other words, Andrew matched the held-back students with students who were equally “at risk” for being held back, but weren’t.
Related story: India data show test scores rise when students are automatically promoted to the next grade
Then Andrew looked at whether these matched students eventually graduated from high school. And that’s where she found that the held-back children were 60 percent less likely to have graduated from high school than their matched “partners” who stayed on grade level. Andrew went one further to see if she could reproduce the results in a different way. Using the 1979 data survey, which included sibling information, she compared children who were held back with their siblings who weren’t held back. Again, she found the same result. Even in the same family, held-back kids were 60 percent less likely to graduate high school than their brothers and sisters. Astonishing!
Andrew acknowledges that held-back students often show a short-term boost in their grades and test scores, but she believes this boost “disappears” after just a few years. A sociologist by training, Andrew hypothesizes that being held back is so psychologically scarring that many students fail to regain their confidence in the long-term. In her paper Andrews argues that being held back is a one of the biggest negative events of a child’s life. “In surveys, students rank being retained in grade second only to a parent’s death in seriousness in some cases,” Andrews wrote.
At first blush, the data seem to defy common sense. (Data have a way of doing that!) Kids, especially boys with fall birthdays, are commonly held back in kindergarten as they get another year to mature. I have a hard time believing that they’re 60 percent less likely to graduate from high school than the kid who stayed with his class and moved on to first grade.
Unfortunately, Andrew wasn’t able to test whether kindergarten retention was less scarring than say, fourth grade retention. But by email she explained that the majority of the students were held back in the earliest grades, confirming that she found even held-back kindergarteners less likely to graduate from high school.
How much you buy Andrew’s conclusions depends on how similar you think her paired children are. If there were a characteristic that prompted a parent to hold back one child that his statistical “partner” doesn’t have, then the analysis isn’t clean. Her control group (the promoted partner) isn’t otherwise identical to the treatment group (the retained child). Andrew’s data sets didn’t list every behavioral problem and learning disability, so she couldn’t control for Attention Deficit Hyperactivity Disorder (ADHD) and other many other conditions. It’s quite possible that some of the held-back children had behavior issues or a mild learning disability and the promoted partner child didn’t. Years later, when Andrew found that the held-back child didn’t graduate from high school, it’s possible that factors related to the student’s behavior or learning issues — being placed in an alternative academic track, for example — impeded his academic career and not the psychological scarring of being held back in first grade.
I don’t want to suggest that ADHD makes it hard to graduate from high school, but I am trying to explain how Andrew’s research can fall into the same trap that the early research on retention fell into. It can accidentally conflate the bad effects connected to a behavioral or learning problem with the bad effects of the retention.
I asked Andrew how a parent should factor in her research when deciding whether to hold a student back. “My study is not a parent’s how-to guide on retention,” she replied by email, explaining that holding a child back is a very personal decision. The most important thing is to address your child’s underlying academic problems, whether you’re holding him back or passing him on to the next grade.
She explained her study is aimed at education policy officials who are deciding whether to have high-stakes tests that determine who moves on and who is held back. “My study is an argument about how a very expensive policy, grade retention, may actually undermine our shared goals of ensuring even child gets a quality education,” she replied. “I would argue that my study is evidence that we might take funds used for an expensive and likely deleterious policy and use them for earlier, pre-school interventions and …supplemental services… to help get a student up to speed.”
Even education data geeks agree that education data is completely inscrutable and inaccessible to parents
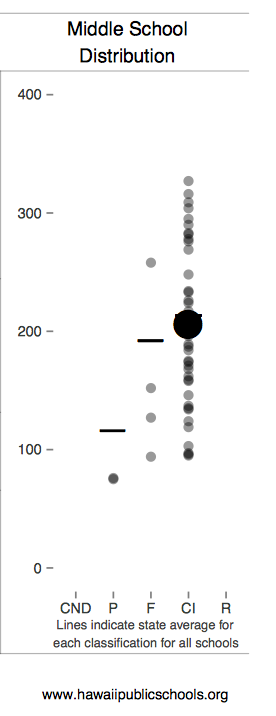
Example of a graphic on a Hawaii school report card
One of the many provisions of the 2001 federal education act, known as No Child Left Behind, was a requirement that states had to issue a “report card” for every public school. The report cards include things you might expect like student test scores and test score changes, but also a laundry list of data from graduation rates to school demographics.
Part of the purpose of making this data available was to help parents see how the students in their children’s school were faring and make more informed choices, whether it’s pressuring the school and district to do better, or taking their children elsewhere.
More than a decade later, much of this data remains inaccessible and inscrutable to parents — even to education experts.
To see the report cards in Florida, for example, you’d have to download Excel spreadsheets, or you can try clicking through a series of user unfriendly screens . In Hawaii, each school’s report includes a baffling distribution chart (see graphic on the right). There is a separate document, twice as long as the report card, that explains how to interpret all the figures and acronyms. Minnesota’s report cards disclose the number of students who are eligible for “celebration.” Of what, one might wonder, birthdays? Another state awarded an elementary school 17.29 points for an “average growth z score” without further explanation. The Education Commission of the States (ECS) issued a August 2014 report, “Rating States, Grading Schools” and concluded that too many report cards are hard to find and hard to understand.
Related story: NCLB co-author says he never anticipated federal law would force testing obsession
It’s a sad outcome because the parents who could take advantage of this data the most, where school improvement is most needed, tend to be from the most disadvantaged and disenfranchised communities. These report cards need to be easily digestible.
“There are smart statistical people good at cranking out data, but they are not known for design. What is good design for a policy wonk, is not a good design for a parents and policy officials,” said John Bailey, a former Bush White House official, who now wears several hats in the education policy world, including vice president at the Foundation for Excellence in Education. (The conservative organization, headed by former Florida Gov. Jeb Bush, supports the greater use of education technology, promotion of charter schools and measuring schools by student test performance.)
By coincidence, in June 2014, Bailey had just collaborated on a paper about the role of prizes and competitions in generating good ideas. And he was inspired by a health design challenge where visual graphic designers reimagined patient information records. “There’s all this very wonky complicated data that’s given to patients that doesn’t make a lot of sense. It’s the same in education,” he said.
So Bailey came up with the idea to use $35,000 of his organization’s money to launch an education data design competition. Ed Excellence has reached out to the design community both for contestants and for judges. The winner will be announced in December.
This article also appeared here.
It sounds like a fun fall project for a Rhode Island School of Design student. But it’ll be a tough challenge for even a seasoned graphics expert to put a school’s test scores in the context of its student demographics in an understandable way. If you just report straightforward test scores, schools with rich students will likely have higher scores than those with poor students. Showing how much students learn each year is better. But measuring academic growth is a complicated task and it’s hard to explain simply. Using regression analysis to adjust for poverty — even more complicated!
Hallmarks of good design are simplicity and minimalism. But state report cards are required to include lots of data. One of the problems mentioned in the ECS report are that parents are already overwhelmed by data. It cited one parent who complained that one report card was“[l]ike reading a corporate financial report of 20 pages.” Bailey hopes that designers will come up with a simple starting point, but give parents an intuitive way to dig deeper if they’re interested. “You don’t have to show all the proficiencies by subgroup on the same page,” Bailey suggested.
Some states and urban school districts have tried to improve their report cards. Washington, D.C. recently revamped its school report cards on its LearnDC website and they’re an inspiring model of simplistic design. Here’s an example. (Still, there are numbers that lack context. What’s that school classification score based on?) And New York City announced on Oct. 1, 2014 that it was revamping its school report cards. In addition to jettisoning simple letter grades for each school, the city is trying to make them parent friendly. Here’s a model example with fictitious numbers. It’s written in plain English, but way too wordy. And for a city that’s filled with brilliant designers, this document lacks inspiration, colors and graphics. Probably not a design competition winner.
Bailey says his ultimate goal is to raise the quality of discourse on education.”The more information that parents and policy makers have, the more informed the debate is going to be,” he said.
Useful report cards also won’t hurt the cause of data proponents, who’ve recently been burnt by the demise of national student data warehouse inBloom. If ordinary parents start to see data as something useful and not just a threat to their children’s privacy, perhaps the data geeks will have enough public support to be able to resurrect their dream of mining vast amounts of student data to improve education.
Related story: Big data and schools: Education nirvana or privacy nightmare?
Homeless students increase by 58 percent in past six years
Despite signs of a national economic recovery, homelessness in U.S. public schools steadily increased 8 percent, to 1.26 million students, in the 2012-13 school year from the previous year. That may not sound terrible, but consider that it is part of a 58 percent jump in the number of homeless students in the six years since the start of the economic recession of 2007-08.
Percent change in the number of homeless students in U.S. public schools over six years (2007/08 to 2012/13)
(Zoom in and click on any state to see actual numbers of homeless students and annual percentage changes for each state. Interactive map created by Jill Barshay and Sarah Butrymowicz of The Hechinger Report.)
“It’s safe to say there’s been a significant increase in homelessness in schools,” said Diana Bowman, director of the National Center for Homeless Education. Her organization, funded by the U.S. Department of Education, provides technical assistance for the federal Education for Homeless Children and Youth Program.
The U.S. Department of Education quietly released this data on homeless students, in grades pre-K through 12, without issuing a press release or detailed report. The new data were added to a publicly accessible database on September 22, 2014 as part of its annual Consolidated State Performance Report Data.
Related story: Poverty among school-age children increases by 40 percent since 2000
Some states saw much larger than average one-year increases in homelessness. Student homelessness in New Jersey grew by 77 percent and in Alabama by 68 percent over the most recent one-year period. Washington, D.C., Maine, Montana and New York also experienced sharp increases in the number of homeless students.
But Bowman cautioned against putting too much stock in sharp one-year fluctuations. States sometimes change counting methodologies; longer multi-year trends are more reliable.
More important, and distressing, is the data for the six-year period. Some less populous states saw some of the largest percentage increases in student homelessness. The number of homeless students grew by more than 140 percent in Oklahoma, Hawaii, Alabama, West Virginia, Montana, Idaho, North Dakota and Washington D.C. The color-coded map above highlights which states have suffered the greatest increases in student homelessness since 2007.
The majority of homeless students are not sleeping outside on park benches. According to the Department of Education’s data, three-quarters of homeless children are temporarily living “doubled up” with extended family members or neighbors. (Table 3 on page 2 of this report, “Education for Homeless Children and Youth, Consolidated State Performance Report Data, School Years 2010-11, 2011-12, and 2012-13” shows where homeless school children spend the night.)
“A lot of people think of families living in shelters,” said Bowman. “But it’s really a lot of other situations where a lot of homeless children live.”
The Department of Housing and Urban Development defines homelessness more narrowly, often not including people who are living with others. But Bowman explained that it makes sense for the Department of Education to have a more expansive definition, because the children of these families have still lost their primary residence and are often switching homes and changing schools every few months. “The education disruption makes it hard for them to perform academically. They’re losing friends and teacher connections. They also have greater health problems and emotional stresses,” said Bowman.
Data source: U.S. Department of Education Consolidated State Performance Report Data, 2007-13. Google chart created by Jill Barshay, The Hechinger Report
Many researchers have documented how devastating episodes of homelessness are for a student’s academic performance, both in the short term and over the long term. McKinney-Vento funds were established by Congress in 1987 to support homeless programs. A portion of these funds go to school districts based on the percentage of poverty in their school district. But, as Table 2 here shows, more than a third of the nation’s 1.3 million homeless children are enrolled in school districts that haven’t received any of these McKinney-Vento funds.
A 2014 University of Pennsylvania study found that homelessness was the third most important risk factor to consider when thinking about support programs for disadvantaged children, and that poverty alone wasn’t necessarily harmful to a child’s academic career.
Perhaps with this well-documented rise of student homelessness, lawmakers will start to think about better ways to strategically allocate Title I education dollars — not just to low-income children, but to the low-income children who need them the most.
Data analysis methodology and explanation: Original source data is from the U.S. Department of Education’s Consolidated State Peformance Report Data, in which states are required to report on a variety of figures, including homeless school children. To locate this data, go to eddataexpress.ed.gov, then click on “Build a State Table,” then “Build Table Now.” That will take you to a “State Tables” page. I clicked all states and then selected data under the “Homeless Program (McKinney -Vento)”. I selected “Total Number of Homeless Students Enrolled in LEAs with or without McKinney-Vento Subgrants – Total” for the all six years available, 2007-08, 2008-09, 2009-10, 2010-11, 2011-12, 2012-13. “LEA” is a local educational agency, commonly known as a school district.
Related story: The number of high-poverty schools increases by about 60 percent
