One study says to get your associate’s degree before moving to a four-year college.
Here’s a perplexing study: students who start at a community college and then transfer to a four-year college are almost 50% more likely to complete a bachelor’s degree within four years if they get associate’s degree first. That’s according Peter M. Crosta & Elizabeth Kopko of Community College Research Center at Teachers College, Columbia University. We know from previous research that most students would be better off starting at a four-year school in the first place. But it seems if you decide to go the community college route, that you might as well finish what you started before moving on.
Related stories:
US DOE evaluation of Gates-funded Early College High Schools shows that low-income males more likely to graduate from high school and enroll in college afterward
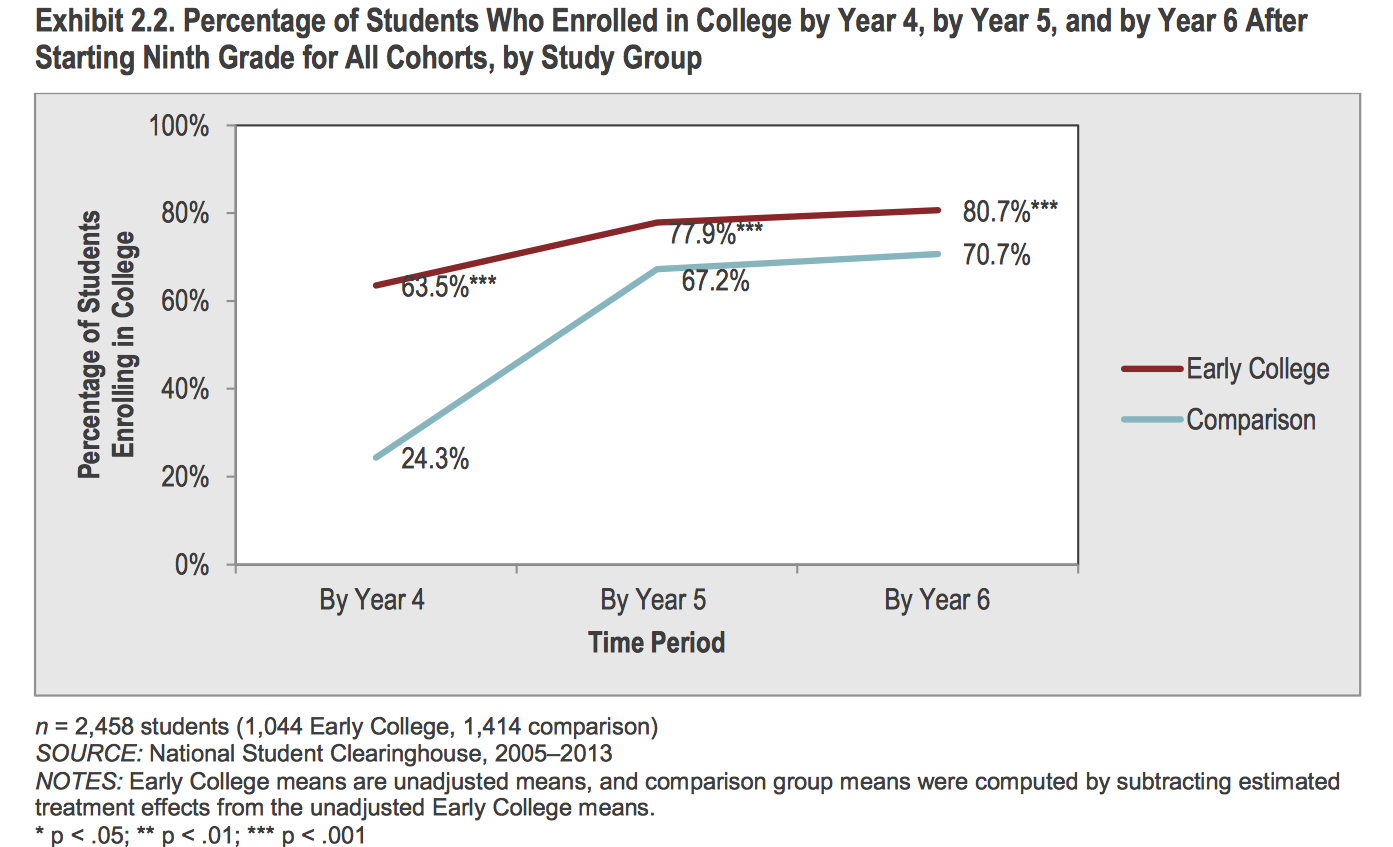
Back in 2013 a study, “Early College, Early Success: Early College High School Initiative Impact Study,” showed that low-income, minority students were showing remarkable results in a new kind of high school where students are marched through the first two years of college during their high school years. In the 10 schools studied, 86% of the students, almost half of which were poor, graduated from high school and 80% enrolled in college afterward. (The study tracked three cohorts (or classes) of students for two to four years after high school).
The Gates Foundation helped start these new early college high schools back in 2002 with the theory that struggling students might be more motivated to learn if they could save time and money by earning an associate’s degree in high school. Instead of offering college credits to only the top high school students, the idea was to use college credits as a psychological motivator with the bottom of the socio-economic ladder who might not otherwise go to college at all. Today there are more than 280 of these early college high schools in 30 states. More than 80,000 students are enrolled in them. And the number is growing. These schools are expensive to run. Most of the ones in the study were located on college campuses and the classes were taught by college instructors. Plus they offered an array of support services, from tutoring and counseling to college preparatory information.
With all the attention that these schools are getting, the Institute of Educational Sciences, part of the U.S. Department of Education, conducted a review of the 2013 study and posted the results in March 2014 on its What Works Clearinghouse website. The DOE evaluation not only confirmed many of the original study’s findings but also praised the study itself. Students enter these schools through lottery and so their results were compared with equally motivated students who also entered the lottery, but didn’t win a seat. Instead they attended 272 different high schools. That’s about as close to a random clinical trial as education research gets. (However, 22% of the students who were offered admission in an early college high school didn’t enroll. Nonetheless, their high school graduation and college enrollment data was lumped together with the kids who did go. So one-fifth of the data for the Early College students comes from students who went to traditional high schools and I can’t help but wonder how that muddies the results.)
Men and Early College
What impressed me was some of the demographic breakdowns of the data in Appendix D. These schools seem to be making a real difference with low income males. Males who went to the Early College High Schools were much more likely to graduate from high school compared to students who lost the lottery and went to ordinary high schools (87% vs. 78%). Similarly low-income students were more likely to graduate from these early college high schools than a traditional high school (83% vs. 74%). Women and non low-income students also graduated from these early college high schools in larger numbers, but the difference was only 2 percentage points. The other number that popped out at me was that males were much more likely to enroll in college after an early college high school (78% vs. 66%). Women were also more likely to enroll in college afterward, but the difference between their counterparts at traditional high schools was only 6 percentage points.
I’d be curious to hear theories on why young men, as opposed to women, might respond more to the early college curriculum and environment.
Remedial classes
But some data disappointed. Eighteen percent of the early college high school graduates who enrolled in college needed to take remedial classes (versus 22% of the students who went to traditional high schools). And even though half the early college high schools claimed to have a STEM (science, technology, engineering and math) focus, the high school math scores of the early college students were no different than the math scores of the traditional high school students.
Then I read a January 2014 study, following up on these same group of students, four to six years later. And I learned that some of the stark differences between kids from the early college and ordinary high schools start to fade. Over time, college enrollment ticks up for the kids who went to regular high schools.
It will be interesting to see college graduation and employment data for these students five years from now.
Related story:
You can’t take it with you; more than 40 percent of community college transfer students unable to transfer their credits to a four-year school

This article also appeared here.
Community colleges enroll about 40 percent of American undergraduates. But many question how rigorous the education is and doubt whether these two-year schools are properly preparing students for four-year degrees or good careers. Researcher after researcher has confirmed that students would be more likely to get a BA degree if they had started at a four-year college in the first place. (See citations here.)
Two researchers at the Graduate Center of the City University of New York conclude that a big reason many community college students fail to get a four-year degree is not because of inferior academic preparation, but because the four year colleges they transfer to won’t accept many of their community college credits.
“The greater the (credit) loss, the lower the chances of completing a BA,” wrote Paul Attewell and David Monaghan, both of the Graduate Center of the City University of New York in “The Community College Route to the Bachelor’s Degree,” published March 2014 in the Educational Evaluation and Policy Analysis (EEPA), a peer-reviewed journal of the American Educational Research Association (AERA).
Specifically, the researchers found that only 58 percent of community college transfers are able to bring all or almost all (90 percent or more) of their credits with them. About 14 percent of transfers lose more than 90 percent of their credits. The researchers calculated that the transfer students’ graduation rate would jump to 54 percent from 46 percent – if not for the loss of academic credits.
“This percentage is potentially underestimated,” said Attewell in a press release. “The obstacle of losing credits is bigger than we could measure.”
New Jersey is the one state that requires its state four-year colleges to accept credits earned in state community colleges. The researchers came up with the 8 percentage point jump in graduation rate by applying the New Jersey policy to the rest of the country.
Despite the difficulty of transferring to a four-year school and graduating, 45 percent of all bachelor’s degrees are awarded to students who have transferred from a community college. That’s according to the National Student Clearinghouse Research Center.
Related stories:
High student loan default rates among largest community colleges
Three things that will make a school bad: child abuse, homelessness and mothers who dropped out of high school

This article also appeared here.
Conventional wisdom has it that schools with high concentrations of poverty are bad. But when a team of researchers led by Dr. John Fantuzzo from University of Pennsylvania’s Graduate School of Education (Penn GSE) studied every third grader in the Philadelphia public schools, they found strong student achievement in some schools with high concentrations of poverty. The low-achieving schools were ones with high concentrations of homelessness and child abuse. Not only did the performance of the students experiencing abuse and homelessness suffer, so did their classmates. High concentrations of students whose mothers did not complete high school were similarly harmful. The whole grade level had lower achievement.
“It’s not poverty itself that predicts achievement. It’s other risk factors that are associated with poverty,” said Heather Rouse, one of the study’s authors.
“We can’t cure poverty. But we could work on interventions to connect with kids who experience these other risk factors, through department of housing and other agencies,” Rouse added.
Rouse’s study was published in Educational Researcher in Februrary 2014 and presented at the American Educational Research Association (AERA) annual conference in April. She and her colleagues had access to a treasure trove of data on all 10,000 third graders in the Philadelphia public schools during the 2005-06 academic year. In addition to education records, the researchers were able to look at birth, health, public housing and human services records for each student.
About 70 percent of the entire population qualified for free and reduced price lunch, a measure of poverty. Only 26 percent of the population had a mother without a high school degree. The schools that had a 10 percent higher concentration of low maternal education had significantly worse math scores, reading scores and attendance records.
The researchers found that some risk factors, such as high lead exposure or having a teenage mother at birth, didn’t affect student achievement much. But substantiated cases of child maltreatment, which affected 10 percent of the population, and low maternal education were particularly harmful risk factors. Episodes of homelessness, which affected 9 percent of the students, came in third.
Related story citing research by John Fantuzzo: Poverty and education reform — and those caught in the middle
Ranking colleges by salaries of graduates
In March 2014 Payscale came out with its annual rankings of colleges based on how much graduates earn after 20 years. As before, there was a lot of grousing about the data. How can we trust the self-reported salaries of people who happen to choose to participate in the Payscale surveys? The #1 college — Harvey Mudd — used self-reported data from only 112 graduates. How can we judge the economic value of a highly selective college where the majority of the graduates go onto grad school? All MBAs, law degrees, medical degrees, PhDs — all students with graduate degrees — are not included. The methodology ends up elevating schools with big engineering programs because many engineering undergraduates go on to earn good livings without going to grad school. And that helps explain why engineering-heavy Stanford and MIT rise well above Harvard and Yale.
The Obama administration is working on its own college ratings system, “Postsecondary Institution Ratings System,” that’s supposed to be up and running in the fall of 2015. The government held a symposium in February 2014 where data experts offered their ideas on how the government should design it. The New America Foundation pointed out in a comment letter that the government already collects a lot of salary information . If we could tap into the Social Security Administration database, then we could have a pretty good sense of what post-college earnings really are at every institution.
Is it possible to do that without violating individual privacy? And does Social Security even track wages above its salary cap of $117,000?
US students rank better internationally on new problem solving test than they do on conventional math and reading exams
 Here’s a modest test result to bolster the argument of those who say the American educational system isn’t so terrible. On a new creative problem-solving test taken by students in 44 countries and regions, U.S. 15-year-olds scored above the international average and rank at number 18 in the world. That’s much better than the below-average performance of U.S. students on the PISA (Program for International Student Assessment) reading and math tests conducted by the Organization for Economic Cooperation and Development (OECD).
“We think teaching through problem solving is already more developed in the US than in other countries,” said the OECD’s Pablo Zoido, in explaining why US students have higher problem-solving scores than expected.

This article also appeared here.
Still, Asian countries and regions dominate the top 10 spots in creative problem solving, with Singapore, Korea and Japan taking first, second and third place. Canada, Australia and Finland were the only non-Asian nations to make it into the top 10. Shanghai, which topped the PISA charts in math and reading, was relatively weaker in problem solving at number 6.
This new problem-solving test, whose results were released April 1, 2014, is also a PISA exam run by the OECD. For the first time in 2012, a separate 40-minute test was given to 85,000 students on a computer, which allowed for more interactive and unconventional questions than paper and pencil. The questions were more like brainteasers than math word problems. Sample questions were about buying the cheapest train tickets and finding nearby spots for three people to meet. Here’s a link to sample questions.
Problem solving is important because more jobs in the future will require complex problem solving thinking skills. The accompanying report highlighted teaching strategies in Singapore, Japan and Alberta, Canada that may be helping to be develop these skills (see pp.119-124).
In the best-performing countries – Singapore and Korea – 15-year-old students, on average, are able to engage with moderately complex situations in a systematic way. For example, they can troubleshoot an unfamiliar device that is malfunctioning: they grasp the links among the elements of the problem situation, they can plan a few steps ahead and adjust their plans in light of feedback, and they can form a hypothesis about why a device is malfunctioning and describe how to test it
Top US students did surprisingly well on the problem-solving test, far better than their math scores would have predicted. Indeed the jump, or gap, from math to problem solving skills was one of the largest that the OECD found. That might be a clue as to why top US students fare so poorly on international tests, but still grow up to be creative engineers and designers.
Students in the United States perform better than expected on interactive items, based on their success on static (non-interactive) tasks. Interactive items require students to uncover useful information by exploring the problem situation and gathering feedback on the effect of their actions. To do so, students need to be open to novelty, tolerate doubt and uncertainty, and dare to use intuitions to initiate a solution.
On the other hand, US students trail the best-peforming countries on knowledge-acquisition and knowledge-utilisation tasks on the problem-solving test.
Newly minted teachers in 2012 on average owe $429 a month
Should future teachers be taking out massive loans to get their master’s of education degrees?
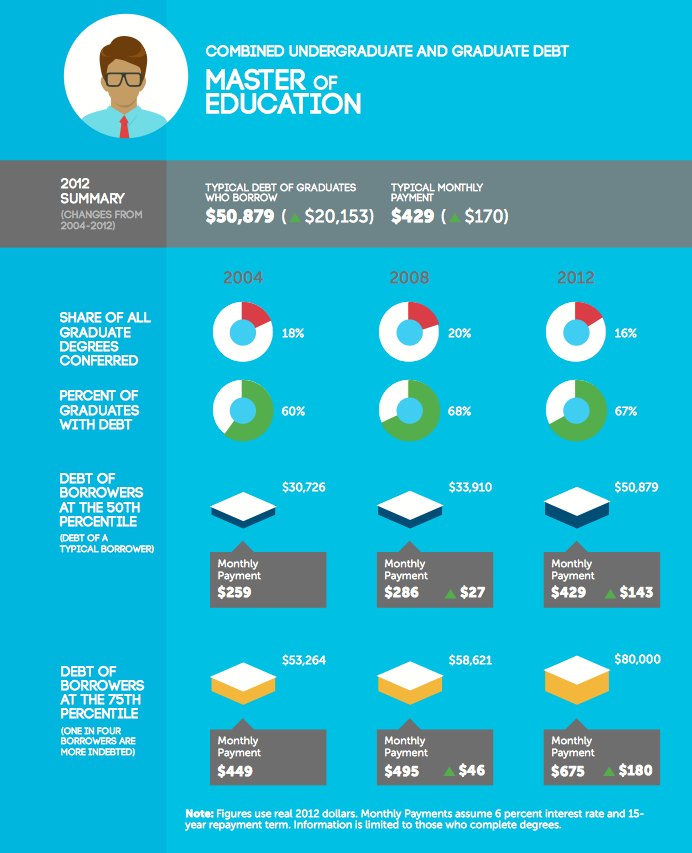
A March 26, 2014 report by the New America Foundation points out that as much as 40 percent of the $1 trillion in student debt outstanding was borrowed not for college, but to pay for grad school. And some 80% of of the debt incurred by students who finished their grad school programs in 2012 wasn’t for people going into medicine, law or business, but for less profitable professions, such as teaching. Indeed, the average graduate of a master’s in education degree finished with more than $50,000 in debt — $8,000 more than the debt of a typical MBA graduate. That’s a 66% increase in the debts of newly minted teachers since 2004. Another way to think about it is that the average newly minted teacher in 2012 has to pay $429 a month in student debt payments. Half owed more.
The report’s authors predict that these teachers and other indebted graduates won’t be able to earn enough money to afford to pay back their loans. That will leave taxpayers holding the bag, effectively subsidizing schools of education.
The recent spike in debt for graduate degrees should also focus policymakers’ attention on the lack of loan limits for students pursuing graduate degrees and income-based repayment programs that include loan forgiveness benefits. The debt statistics in this New America report suggest that graduate and professional students are likely borrowing at levels that will lead to substantial waves of student loan forgiveness in the coming years.
A footnote in the report explains how grad school loans work.
The federal government lets graduate and professional students finance the entire cost of their educations with federal loans, for any degree, for any length of time, including all living expenses, regardless of the total cost. Graduate and professional students may first take out $20,500 per year in Unsubsidized Stafford loans, and after that, they can tap federal Grad PLUS loans for the rest of the costs. A series of programs, Income-Based Repayment, Pay As You Earn, and Public Service Loan Forgiveness, that lawmakers enacted in 2007 and 2010 let borrowers repay those loans based on a small share of their incomes, regardless of their debt loads. After 10 or 20 years, remaining balances are forgiven. Note that undergraduates face relatively low limits in the federal loan program, thereby limiting the benefits of loan forgiveness under these plans. That is because a borrower entering repayment with $30,000 in federal loans could have his debt forgiven under one of the repayment programs only if he earns an unusually low income for an extended period of time. Someone with a master’s degree who has $80,000 in debt, on the other hand, can earn an average income for his peer group for most of his repayment term and his payment will still be too low to fully repay the debt. He will have a balance forgiven.
The New America Foundation used the the PowerStats tool from the National Center for Education Statistics to analyze data from the U.S. Department of Education’s National Postsecondary Student Aid Study (NPSAS). That study is conducted every four years.
Related stories:
U.S. teachers 6th highest paid in the world
US rookie teachers relatively better paid than veteran teachers
Whites and Asians have a disproportionate share of pre-k seats in NYC
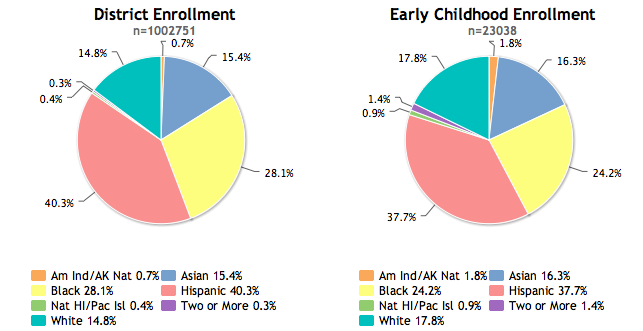
These pie charts show that whites make up fewer than 15 percent of the student population in New York City’s public schools, but they took nearly 18 percent of the city’s limited and coveted pre-kindergarten slots in the 2011-12 school year, the most recent year that data was available. That’s according to an interactive civil rights database released by the U.S. Department of Education on March 21, 2014.
Asians also took a larger share of pre-k seats than their school population would suggest. Meanwhile, both blacks and Hispanics seem to be on the short end of the stick. Blacks account for more than 28 percent of the public school population, but secured fewer than one quarter of the roughly 23,000 public school seats for four-year-olds. Hispanics make up more than 40 percent of the school system, but received fewer than 38 percent of the pre-k slots.
NYC Mayor Bill de Blasio is pushing to expand the school system to offer public pre-k slots to every child in the city. To win a seat in the current allocation system, parents must register online or in person. A lottery then allocates the limited seats available, but the lottery is not random. Younger siblings of current students are slotted first. Geography matters too. Families who live within the school zone of a particular pre-k program are prioritized.
Related stories:
Notable research on pre-kindergarten education
Could New York’s Pre-k plan pit politics and posturing above kids?
Schools struggle to count algebra classes

This article also appeared here.
Politico posted a nice roundup of new data from the U.S. Department of Education on March 21, 2014 that highlights racial inequities in education. They led with the provocative statistic that more than 8,000 three- and four-year olds were suspended from preschool in 2011, but most of the story covers how minorities have less access to important math and science classes and experienced, well-trained teachers.
Deep into the story, there’s a critique of the data that made me pause.
The federal report found that barely half of Georgia’s high schools offered geometry; just 66 percent offered Algebra I.
Those data are just plain wrong, said Matt Cardoza, a spokesman for the Department of Education. The state requires Algebra I, geometry and Algebra II for graduation, so all high schools have to offer the content — but they typically integrate the material into courses titled Math 1, 2, 3 and 4, Cardoza said. He surmised that some districts checked “no” on the survey because their course titles didn’t match the federal labels, even if the content did.
“It’s the name issue,” Cardoza said. “I think schools just didn’t know what to say.”
This is admittedly a digression from a very important point about access to high quality education in the United States, but I wonder if miscounting math courses is rampant. Increasingly popular International Baccalaureate programs call their advanced math classes IB Math HL and IB Math SL. There’s a lot of calculus in those classes, especially the HL. Are they included in the national data that say only half of all high schools offer calculus?
Student loans still growing faster than any other debt and now most likely to be 90-days-plus delinquent
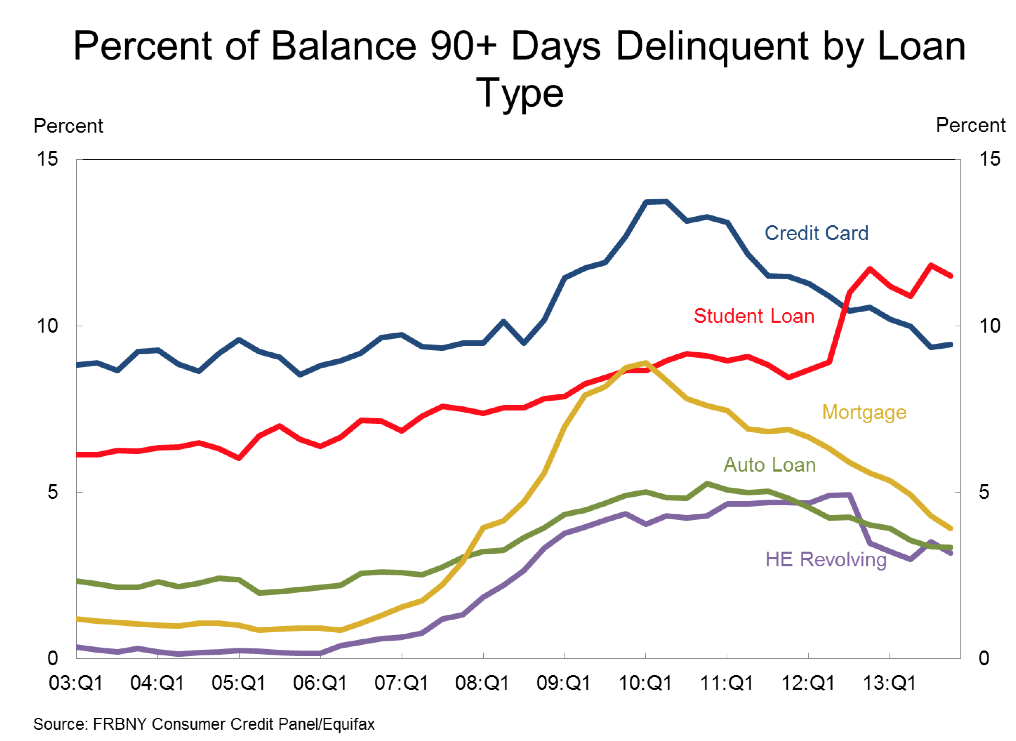
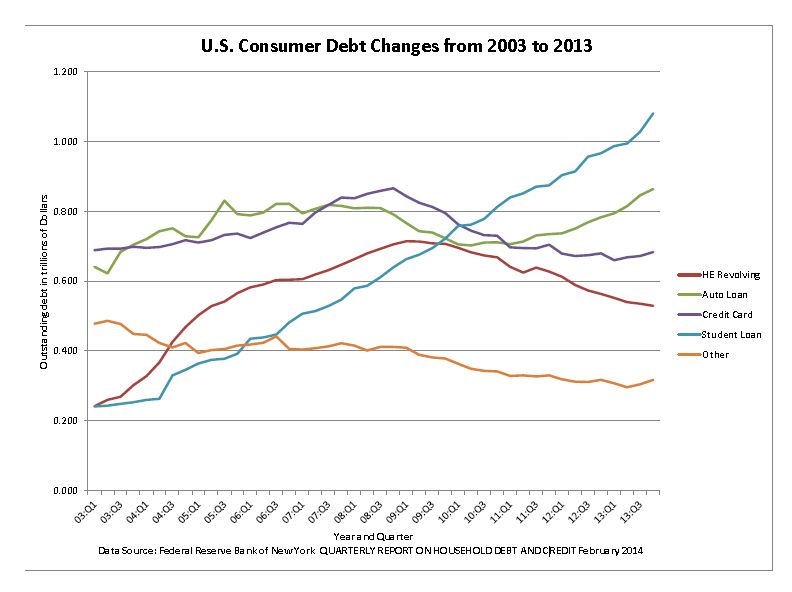
Back in 2010, student loan debt outstanding in the United States surpassed outstanding credit card debt. Student loan debt hit the $1 trillion mark in 2013. It’s still the fastest growing consumer debt and a lot of it isn’t getting paid back. That’s according to the most recent consumer debt report by the Federal Reserve Bank of New York released on February 18, 2014.

This article also appeared here.
The Federal Reserve Bank of New York tracks student loans, both those issued by the federal government and private banks, and releases a quarterly report. In the 2013 year-end report (Q4 2013), outstanding student loan balances reported on credit reports increased to $1.08 trillion, a $114 billion increase for 2013. About 11.5% of student loan balances are 90+ days delinquent or in default. That makes them both the fastest growing and the most troubled type of consumer loan. (Click on the chart above to see a larger version).
I created this time series chart to show how student loan debt has grown over the past decade. (Click on the chart to see a larger version. Student debt is colored in blue.) The data came from this page on the FRBNY website. I used “page 3” data, but deleted mortgage debt because its overall size dwarfs all the other consumer debt categories and you wouldn’t be able to see the shocking increase in student loan debt. The debt is increasing due to both new loans being taken out by students and interest charges accruing on old loans.
In a February 2014 FRBNY blog post analysis of growing student loan debt, Just Released: Who’s Borrowing Now? The Young and the Riskless!, the authors point out that while overall debt fell between 2006 and 2013 (as households retrenched after the 2008 credit crisis), student loans grew.
“First, student loans grew the most of any debt product in both periods (in percentage terms). Second, the growth in educational debt, like that of auto loans, is concentrated among the lower and middle credit score groups.”
Here’s a link to the Federal Reserve Bank of New York Report and to an interactive chart showing how student loan debt is hitting the young and those with low credit scores the hardest.

