

Poor parents: Federal data show more parents going into more debt to send kids to college
Data source: NCES Digest of Education Statistics
Table 331.95.
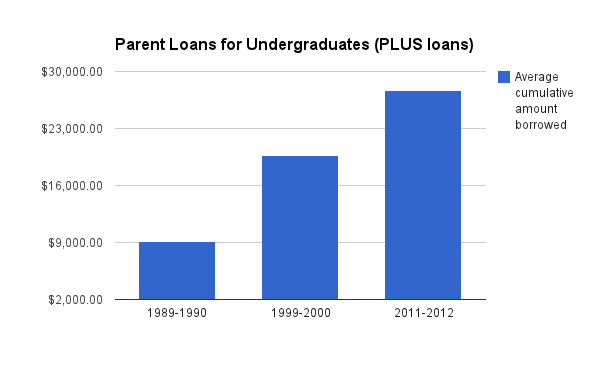
The most recent data on how Americans pay for college show that parents are taking on more of the debt burden for their kids. In 1999 about 13 percent of parents took out PLUS loans. The average loan amount was $19,700 in inflation-adjusted dollars. By 2011, the numbers had increased to 21 percent of parents taking out college loans for their kids, each with a debt of $27,700 in inflation-adjusted dollars. That’s a 60 percent jump in the percentage of parents taking out loans and a 40 percent jump in the loan amount.
“One of the biggest changes we’re seeing is that parents are borrowing a lot more money,” said Susan Aud of the National Center for Education Statistics, speaking on May 18, 2014 about long-term trends in the National Postsecondary Student Aid Study, which tracks how students pay for college.
PLUS loans (Parent Loans for UndergraduateS) are direct loans from the federal government. They don’t include all parent borrowing to pay college bills. Some parents take out home equity loans or go into credit card debt, which this data doesn’t capture. But PLUS loans are probably still a good indicator of parent financing trends because their low fixed interest rates make them very popular.
Some of the increase in PLUS loans may not only be a reflection of changing parenting philosophies and rising college costs (i.e. indulgent parents who don’t want to saddle their children with crazy high college debts) but also a reflection of how much easier it is for parents to navigate the federal student loan system through a single application. The U.S. Department of Education took over the student loan system in 2010. Previously banks and other private sector lenders issued government-guaranteed loans.
Why are the scores of the nation’s top high school seniors stagnant?
On May 7, 2014 I argued that the stagnation of U.S. high school seniors’ test scores can’t be blamed on demographic changes because the scores of top students, the 90th percentile, have been flat too.
Fredrik deBoer wrote on his website that we should never be surprised by stagnant performance at the top because “there are likely ceiling effects at play.” That is, top students might already be acing the test and there’s not much more room for the students to grow. They can’t show gains. I posed that question to Arnold Goldstein, a statistician at the National Center for Education Statistics who works on the reporting of the NAEP test results. He said there’s no indication that top students are bumping their heads against any test ceiling. “The students aren’t scoring anywhere near the top of the NAEP scale,” he said.
Of course, there are more subtle aspects to ceiling effects. It’s possible that top students are acing all the algebra, geometry and calculus questions that they could possibly be expected to answer. Perhaps the topics they’re not getting right are ones that aren’t taught in high school, such as ring and field theory. You’d have to analyze the more difficult NAEP questions one by one, but I doubt that the exam makers have included advanced math topics intended for college math majors.
Liana Heitin at Education Week correctly points out that it’s not exactly apples-to-apples to compare percentile scores over time. Because of the demographic changes in the overall student population (more minorities, fewer dropouts, etc.) , it may be a lower threshold to make it into the top 10 percent. It’s quite possible that top 10 percent of students is a weaker 90th percentile today than it was in 1992.
Heitin, citing Morgan S. Polikoff, an assistant professor at the University of Southern California’s Rossier School of Education, called this kind of percentile analysis “misleading”.
Having lower scores at the 90th percentile doesn’t necessarily mean the top performers weren’t doing any better–it could just as well mean there was an influx of lower performers who brought all the scores down. So it wouldn’t take as high a score to be considered a high performer.
I’ve been paying extra attention to percentile comparisons since I started this blog. I’m quite interested in why top U.S. students appear to be falling further behind internationally as students in other countries make great leaps forward. Is the 90th percentile today a much weaker group of students who needed a far lower score to make it into the top tier? Is the top 10 percent of 30 years ago more like the top five percent today?
Related stories:
Top US students lag far behind top students around the world in 2012 PISA test results
Researchers give failing marks to national effort to measure good teaching
 School systems around the country are trying to use objective, quantifiable measures to identify which are the good teachers and which are the bad ones. One popular approach used in New York, Chicago and other cities, is to calculate a value-added performance measure (VAM). Essentially, you create a model that begins by calculating how much kids’ test scores, on average, increase each year. (Test score year 2 minus test score year 1). Then you give a high score to teachers who have students who post test-score gains above the average. And you give a low score to teachers whose students show smaller test-score gains. There are lots of mathematical tweaks, but the general idea is to build a model that answers this question: are the students of this particular teacher learning more or less than you expect them to? The teachers’ value-added scores are then used to figure out which teachers to train, fire or reward with bonuses.
Two academic researchers from the University of Southern California and the University of Pennsylvania looked at these value-added measures in six districts around the nation and found that there was weak to zero relationship between these new numbers and the content or quality of the teacher’s instruction.
“These results call into question the fixed and formulaic approach to teacher evaluation that’s being promoted in a lot of states right now,” said Morgan Polikoff, one of the study’s authors, in a video that explains his paper, “Instructional Alignment as a Measure of Teaching Quality,” published online in Education Evaluation and Policy Analysis on May 13, 2014. “These measures are not yet up to the task of being put into, say, an index to make important summative decisions about teachers.”
Polikoff of the University of Southern California and Andrew Porter of the University of Pennsylvania looked at the value-added scores of 327 fourth- and eighth-grade mathematics and English language arts teachers across all six school districts included in the Measures of Effective Teaching (MET) study (New York City, Dallas, Denver, Charlotte-Mecklenburg, Memphis, and Hillsborough County, Florida). Specifically, they compared the teachers’ value added scores with how closely their instructional materials aligned with their state’s instructional standards and the content of the state tests. But teachers who were teaching the right things weren’t getting higher value-added scores.
They also looked at other measures of teacher quality, such as teacher observations and student evaluations. Similarly, teachers who won high marks from professional observers or students were also not getting higher value-added scores.
“What we’re left with is that state tests aren’t picking up what we think of as good teaching,” Polikoff said.
What’s interesting is that Polikoff’s and Porter’s research was funded by the Gates Foundation, which had been touting how teachers’ effectiveness could be estimated by their students’ progress on standardized tests. The foundation had come under fire from economists for flawed analysis. Now this new Gates Foundation’ commissioned research has proved the critics right. (The Gates Foundation is also among the funders of The Hechinger Report).
Polikoff said that the value-added measures do provide some information, but they’re meaningless if you want to use them to improve instruction. “If the things we think of as defining good instruction don’t seem to producing substantially better student achievement, then how is it that teachers will be able to use the value-added results to make instructional improvements?” he asked.
Polikoff concludes that the research community needs to develop new measures of teacher quality in order to “move the needle” on teacher performance.
Education majors going out of favor
Data source: Digest of Education Statistics
Graphic: NPR
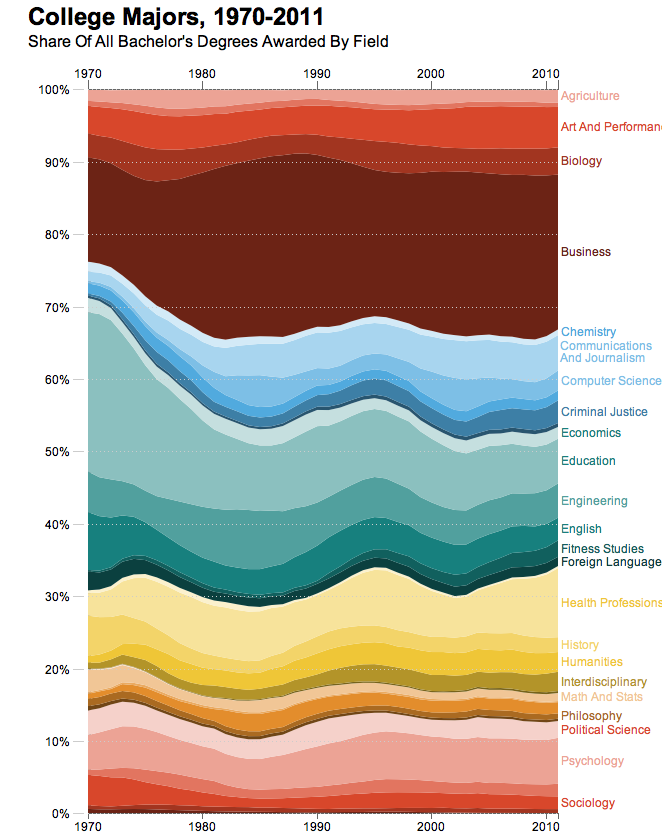
NPR’s Planet Money posted a wonderful graphic, tracking the popularity of various undergraduate majors. I wish I had thought to do this from basic data in the Digest of Education Statistics.
Planet Money immediately pointed out the decline in education as an undergraduate major.
The education degree saw a dramatic decline, falling from 21 percent of all graduates in 1970 to just 6 percent in 2011. Does this mean there’s a huge shortage of teachers? Not necessarily — it just means that far fewer students who go on to be teachers actually graduate with an education degree. According to the Department of Education, as recently as 1999 roughly two-thirds of new teachers graduated with an undergraduate degree in education. By 2009, that figure fell to just half.
I’m wondering, how it important it is for teachers to have majored in education? I’ve always advised aspiring journalists to study the subject they want to write about. If you want to be a foreign correspondent, study world history, international relations or political science. You can learn newspaper writing on the job or go to grad school in journalism later.
That would be great if more teachers are now studying the subjects they want to teach. Unfortunately, it doesn’t seem that future teachers are migrating from education to math and English. Both of those majors are going out of favor too.
Preschool spending declined across the nation by $190 million in 2012-13
Just as the Obama administration and lefty mayors like New York City’s Bill de Blasio are calling for universal pre-kindergarten programs, the National Center for Education Statistics released a report, “The State of Preschool 2013,” May 8, 2014 showing that preschool spending is on the decline across the country.
“Federal Government and Total expenditures from all identified sources supporting state preschool programs equaled $6.2 billion in 2012-13, representing a decrease from the previous year’s inflation-adjusted total of $6.39 billion….Compared to 2011-12, state funding per child for preschool declined in 21 of 41 states with programs in 2012-13 (table 3)”
Connecticut and Arkansas show unusual gains on test of high school seniors; Massachusetts shows sharp decline
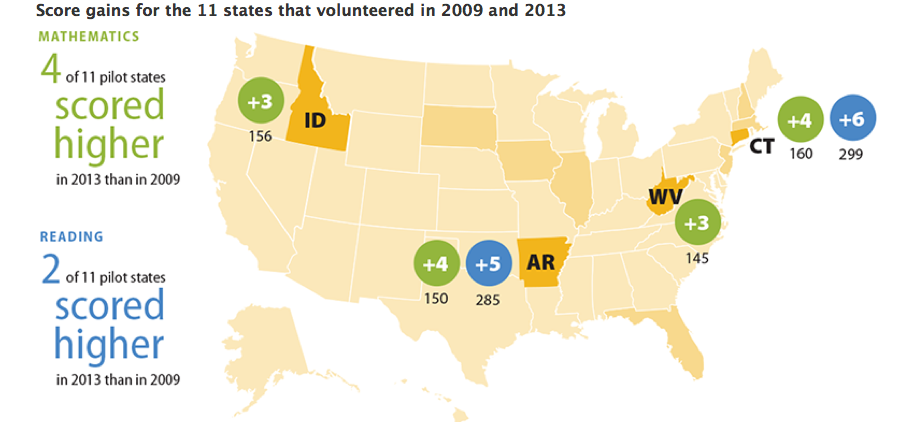 I previously wrote about the woeful stagnation among U.S. high school seniors on a national reading and math test whose 2013 results were released May 7, 2014. But two bright spots are in Arkansas and Connecticut. Both state’s high school seniors showed a notably large 4 point increase on their math test and even larger increase in reading. (6 points in CT and 5 points in AR). They were among 11 states that have volunteered to test a larger sample of their state’s students so that the National Center for Education Statistics could report separate statewide results. It’s also possible that other states would have shown large gains too, had they agreed to do extra testing, but they would be buried among the national data.
Meanwhile, Massachusetts, generally the top performing state in the nation, showed a significant decline in math and reading scores among high school seniors, falling 2 and 3 points respectively.
Officials from the National Center for Education Statistics provided no answers for why Arkansas and Connecticut were improving more than other states. It’s often easier to show large gains off a small base and that might help explain why Arkansas and West Virginia, two low performing states, showed notably large improvements. Even with this year’s improvements, Arkansas’s scores are still south of the national average. But Connecticut started above the national average and its seniors are now ahead of Massachusetts in reading and only one point behind Massachusetts in math.
In separate state reports, the NCES noted that Connecticut is also making headway in closing the black-white achievement gap. In reading it narrowed from 36 points in 2009 to 27 points in 2013.
Related stories:
High school wasteland: Demographic changes do not explain test-score stagnation among U.S. high school seniors
Source: NCES
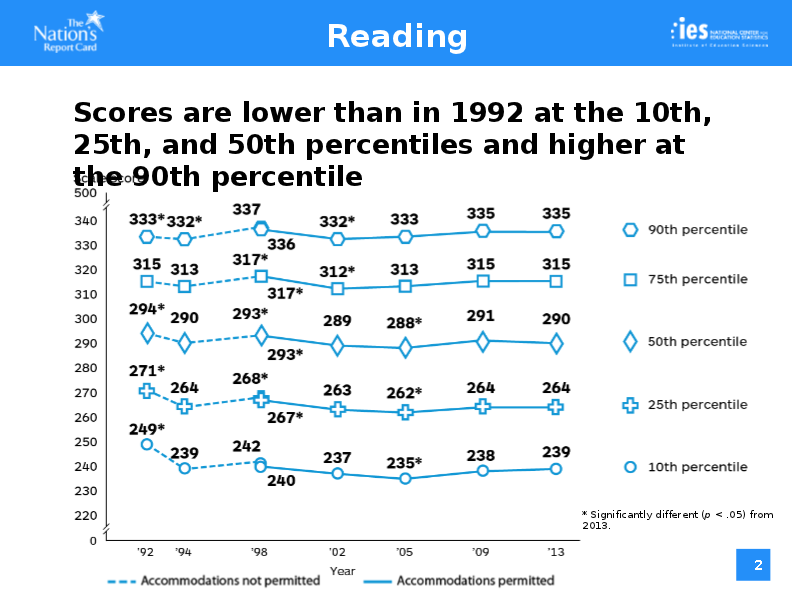
The National Assessment of Educational Progress, run by the U.S. Department of Education, is the only test that is administered in schools across every state in the nation. Fourth and eighth graders across the country have shown meaningful progress on it since the early 1990s, especially in math. The 2013 results in these younger grades even showed small improvements from 2011. (Source: NAEP Mathematics and Reading 2013).
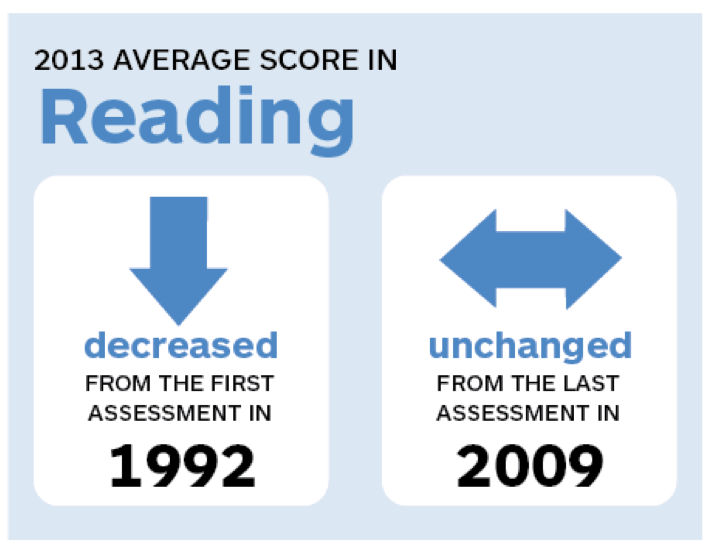
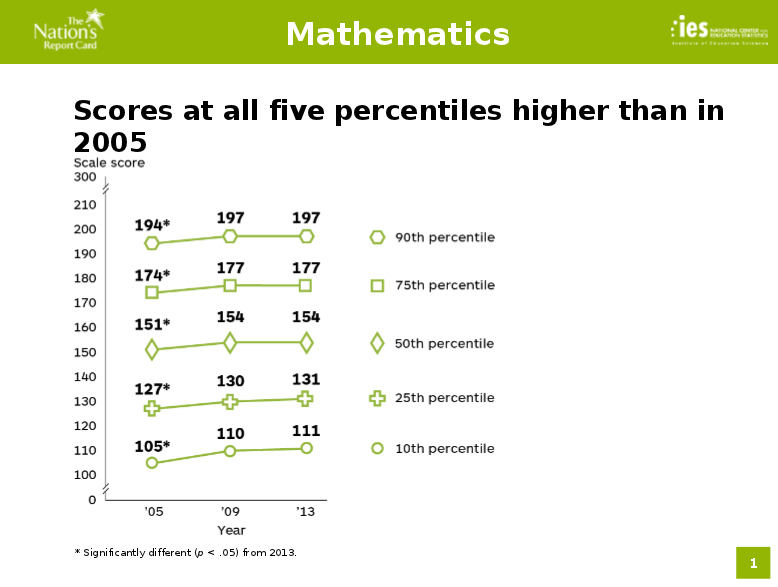
But the 2013 testing results for twelfth graders, released May 7, 2014, are woefully stagnant. The scores for high school seniors haven’t improved at all since 1992, when reading tests were first administered. Indeed, today’s reading scores are actually lower than they were in 1992. The math results, which date back to only 2005, show a modest increase right after that first year. But it’s been complete stagnation since.
It’s hard to make sense of this data. How do you explain why there are improvements in fourth and eighth grade, but not twelfth?

This article also appeared here.
One explanation could be demographic changes. Today there are many more minorities in twelfth grade. The Hispanic population, which has typically scored lower, has exploded. Hispanics have tripled from 7% of high school seniors in 1992 to 20% in 2013. The white population, which has traditionally scored higher, has declined from 74% to 58% in the same time period. More students are diagnosed with a disability today (11% in 2013 vs. 5% in 1992). More students are English language learners.
Furthermore, the high school graduation rate has jumped from 74 percent to 81 percent. That means that the weakest students who used to drop out of high school and, were previously not around in twelfth grade to be tested on the NAEP, are now taking the test.
“Our twelfth grade population is our population. And we don’t explain away test scores based on demographics. But it’s useful to keep in mind that we are seeing increases in subgroups that have traditionally performed lower,” said John Easton, acting commissioner of the National Center for Education Statistics and director of the Institute of Education Sciences.
The pool of high school students being tested in 2013 is clearly a weaker pool than the one tested in 1992. That might be masking improvements that we otherwise would have seen had demographic changes not occurred.
But here’s the thing. When you look at top achieving students in the top 75th and 90th percentiles, their scores are FLAT. (See the NCES charts below). High achieving students aren’t improving at all. So you can’t blame the infusion of more low performing students in the testing pool for the disappointing test scores. Even if we hadn’t introduced a greater number of weaker students into the mix, the scores of our high school students would still be stagnant.
Indeed, when you drill down by percentile, it’s the weakest students who are showing modest improvements. If not for their improvements, the national average would have declined!
Source: NCES
Related stories:
Teachers, students and adult public more supportive of school testing than you might think
Source: NWEA
You might guess that standardized tests are the bane of both teachers’ and students’ existences, but two different opinion polls show a surprising level of support for bubbling in circles with number 2 pencils. In Teachers versus the Public, a book published on April 29, 2014, Harvard Professor Paul E. Peterson reports that 86 percent of the public and 77 percent of public school teachers support using tests for graduation. In other areas, from teacher pay to unions, there’s a giant gulf between teacher perceptions and public perceptions.
“Accountability is one of the issues where the public and teachers agree” said Peterson.
Similarly, Northwest Evaluation Association, a non-profit maker of standardized tests, released a (self-serving) survey May 6, 2014 showing 94 percent of students agree that tests are very or somewhat important for understanding what they are learning. Among teachers, 50 percent say they could not be good teachers without any assessments in their teaching. (One can quibble with the wording of the question. I suspect that you would get a very different result if you asked teachers what they thought about the assessments that they are being forced to prep students for right now. )
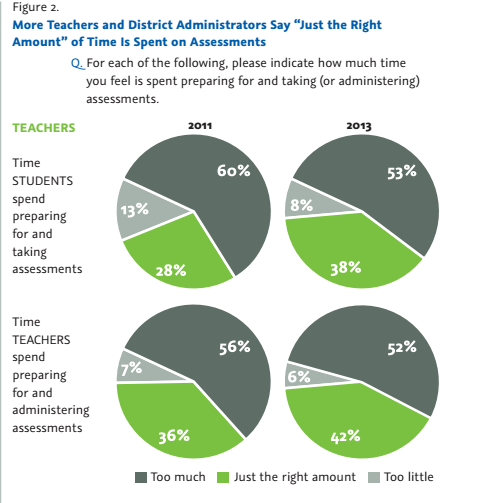
But is seems that teachers are softening their resistance to testing. Two years earlier in 2011, 60 percent of teachers thought that students were wasting too much time preparing for and taking assessments. In 2013, only 53 percent of teachers thought too much student time was devoted to testing.
The divide on how to educate fidgety boys: challenge them, let them run around or hire more male teachers?
David Leonhardt wrote about how U.S. boys are falling behind at school and later in the workplace in “A Link Between Fidgety Boys And a Sputtering Economy,” (NYT April 20, 2014). He nicely summarizes the divide on what to do about it. Some scholars argue that it’s ridiculous to ask young boys to sit still for hours every day. Others say the dearth of male elementary school teachers creates problems. Still others say that better schools would motivate boys to learn.
When good grades bring high status, boys respond. To the researchers in this camp, the answer involves improving schools, which will have a disproportionate effect on boys, rather than changing schools to be more attentive to boys’ needs.
This reminded me of the research I wrote about in April 2014 that said boys disproportionately benefitted from early college high school programs. Perhaps the challenge brings out the competitive instinct.
These schools seem to be making a real difference with low income males. Males who went to the Early College High Schools were much more likely to graduate from high school compared to students who lost the lottery and went to ordinary high schools (87% vs. 78%).
Similarly low-income students were more likely to graduate from these early college high schools than a traditional high school (83% vs. 74%). Women and non low-income students also graduated from these early college high schools in larger numbers, but the difference was only 2 percentage points. The other number that popped out at me was that males were much more likely to enroll in college after an early college high school (78% vs. 66%). Women were also more likely to enroll in college afterward, but the difference between their counterparts at traditional high schools was only 6 percentage points.
So perhaps boys respond more to early college high schools because the high status of earning college credits appeals to their inner alpha male.
Related story:
Can we use the same problem-solving tricks for classrooms that we use on the assembly line?
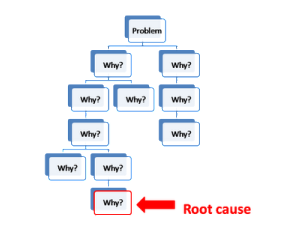 Back in the late 1950s the Japanese auto maker Toyota developed a novel approach for fixing problems on its production line: root cause analysis. Rather than making a bandaid repair on a visible symptom, the idea was to ask a series of five “why” questions to get at the underlying root problem and fix that so that the problem doesn’t keep recurring. Here’s an example I found on another website.
Problem: The computer monitor is not working.
Why? The monitor’s light signal is not on.
Why? The monitor’s power cord is not functioning.
Why? The cord is damaged.
Why? It was placed under a heavy load.
Why? I didn’t place the cords properly when the monitor was plugged in, which caused damage.
The answer to the last why is the root cause of the initial problem of the computer monitor not working.
Critics of this approach pointed out that the answers to each why question were based on gut hunches and guesses. Different employees could ask a different series of why questions leading to completely different root cause determinations. So manufacturers started using statistical approaches to determining the answers to why questions. One of the more famous ones is embedded in a management technique called Six Sigma, developed by Motorola in the 1980s. This rigorous data analysis approach to fixing problems reduced manufacturing defects to nearly zero.
Over time root cause analyses became so popular that other industries, from retail to health care, began adapting and adopting it in their workplaces.
Now educators are experimenting with applying this kind of data analysis to fixing problems in the classroom. This coming wednesday, April 30th, the U.S. Department of Education’s Institute of Education Sciences is offering a webinar on how to apply root cause analysis to education. The agenda indicates that Roni Silverstein, Principal of Fallsmead Elementary School in Montgomery County, Maryland is already using it in his school. A second webinar is scheduled for November 5, 2014.
I’d be curious to learn what areas of education would most benefit from this kind of assembly-line data analysis. I suspect that if you started with the big problems, such as, student achievement is too low that five why questions aren’t going to get you to an root cause answer that you can act upon. And I worry that each student is so different that it’s hard to come up with a math teaching fix that will apply equally well to the students who are two-years behind grade level as to the ones who have already mastered the material and are bored. Even a simpler problem, such as too few students are submitting homework, might have a multitude of answers to the question why.
