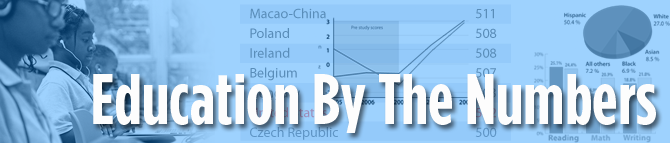

Determining “cut scores” as New York students take the first Common Core high school exams
Page 56 of Board of Regents “Setting Performance Standards” dated June 23, 2014
New York State education policy makers had a difficult task when they sat down to grade the first high school Regents exams linked to the Common Core standards, in algebra and English, last month. They needed to establish a high bar for meeting the new education standards, yet at the same time protect current students, who haven’t had much Common Core instruction, from punishment. And the Regents are high stakes tests: New York students must pass five of them to graduate from high school.
New York risked a high school dropout crisis if they set the bar too high. But setting the bar too low invites criticism that the new Common Core standards are hollow. “That ends up signaling to teachers that you don’t actually need to know the content,” said Kathleen Porter Magee, a Common Core proponent at the conservative Thomas B. Fordham Institute.
Which is why policy makers fussed over the fine-tuning of cut scores — that is, the numerical point where the cut is made between passing and failing.
At the end of June, the Board of Regents released documents showing how they had calculated two different cut scores that effectively split the baby. They set one passing score for today — one that the majority of students can already attain — and a second passing mark for the future, showing how far students must progress to be ready for introductory college classes.
Only 22.1 percent of New York’s algebra students — mostly eighth and ninth graders — hit that aspirational mark in June. In English, it was much better, with 46.8 percent of the 11th graders who took the test hitting the college-ready mark. The class of 2022, currently about to enter fifth grade, will be required to hit these higher thresholds to pass and graduate. That’s a tall order in education, where progress is usually slow and incremental.
Originally, New York State had planned to require students to hit the college-ready mark on this first go-around. But after the uproar over low passing rates for New York’s first Common Core tests for elementary and middle school students, in 2013, Regents officials backed down in February of 2014 and created a safe harbor for current students. After students took the new tests on June 3, scorers were told to make sure that the passing rates didn’t differ from previous years.
In the June documents (on page 55) the Regents noted that the historical pass rates for algebra exams had ranged from 64.5 percent to 74.6 percent, but they chose a pass rate of 65.4 percent for June 2014. While a peculiar and notably low number, it allowed the Regents Board not to lower the floor too much on current students. When New York lined up all the student test results from lowest to highest, 65.4 percent of students had been able to get at least 30 out of 86 questions correct. If the Regents had lifted the new required pass rate any higher than 65.4, they’d have had to pass students who got fewer than 30 correct answers.
“They’ve never had to do that before; it would have been humiliating for them,” said Carol Burris, the principal of a high performing high school in Rockville Centre on Long Island, and an outspoken critic of the state’s approach to testing.
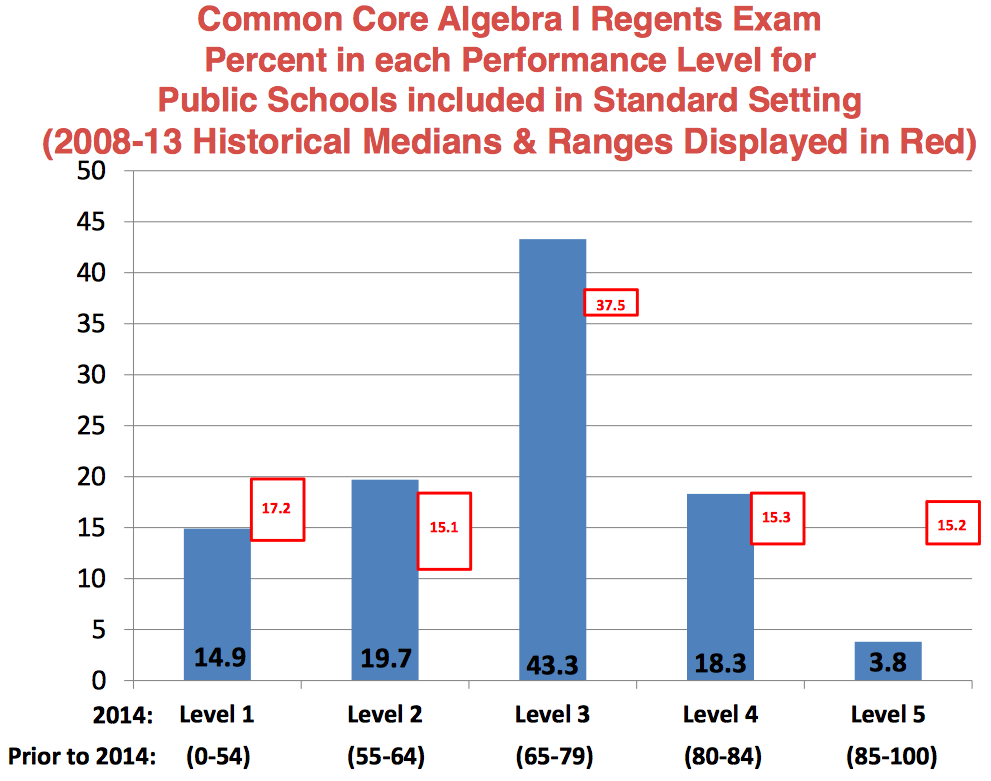
Meanwhile, the Regents used their traditional approach for setting two higher levels of passing scores. They assembled a panel of educators who took the math test and pooled their collective judgment. The educators decided that students ought to have gotten 54 of 86 questions correct to meet the new Common Core standards (the college-ready threshold mentioned above) and 73 questions correct to prove “mastery” of those new standards. Only 3.8 percent of New York’s eighth and ninth graders hit the mastery level on the new algebra exam, compared with more than 15 percent on the easier pre-Common Core exam. The graphic on the upper right corner shows how much tougher it is to be excellent in the new Common Core universe. (Click on it to see a larger version).
To understand how unusual the new Common Core Regents grading curve is, imagine a 10-question test, where you need to get 3.5 questions right to pass, but 6 right to get a B, and 8.5 right to get an A. On the old test, by comparison, you would have needed a similar 3.4 to pass, but only 4.5 correct to get a B, and 7.5 to hit the A. (I calculated these thresholds from Regents conversion charts here and here).
On the English exam, the Regents did almost the opposite. They picked a notably high pass rate of 76.6 percent on their historical range of 69.9 percent to 78 per cent. But then they used a complicated process of overweighting the writing questions so that students could still pass, even if they bombed the multiple-choice reading comprehension section. Burris, the Rockville Centre principal, pointed out that you could still pass if you got as few as 5 out of the 24 multiple-choice questions correct — that’s worse that random guessing.
Indeed, the passing bar was so low for the Common Core English exam that there were reports that some students who failed the old exam (also administered in June) were able to pass the Common Core version. By all accounts, the Common Core English exam, modeled after the English Advanced Placement exam, was much tougher, with triple the amount of reading than previous English Regents exams — but easier to pass, because it was graded more leniently.
Perhaps the reason for selecting an easier pass bar for English has to do with the types of students who took this exam. Unlike the algebra exam, which the state required for every first-time algebra student, the new Common Core English Regents test for 11th graders was voluntary. (Students could take one or the other, or both.) Burris, for example, opted to give only the old pre-Common Core exam to her students. She said her informal survey of other Long Island principals found many had done the same thing. Those who did give their students the new Common Core English exam often gave it only to their honors and advanced students, she said.
If Burris is right, that means scores could be even lower two years from now, when the full student population takes the new exam. And it will be just as steep a mountain to get New York’s high schoolers college ready in English as it will be in math.
What makes for happier teachers, according to international survey

OECD 2013 TALIS Survey
Teachers who say they get included in school decision-making and collaborate often with other teachers are more likely to say that teaching is a valued profession in their society. In turn, these same teachers report higher levels of job satisfaction and confidence in their ability to teach and to motivate students, according to a 2013 survey of middle-school teachers in 34 countries and regions around the world conducted by the Organization for Economic Co-operation and Development (OECD) and published on June 25, 2014.

This article also appeared here.
The TALIS survey included class sizes, but OECD analysts found no correlation between class size and job satisfaction. Indeed, some of the higher performing nations with the highest teacher job satisfaction rates have some of the larger class sizes. The TALIS report found that the size of a random class in the United States was 27 students, compared with 36 in Singapore and 32 in Korea.
More important to teacher satisfaction than class size is the type of student in his classroom. The more behavioral problems and low-peforming students in the class, the more unhappy a teacher was. But the OECD also said these negative effects were mitigated in schools that had a supportive, collaborative atmosphere to help teachers handle behavioral disruptions. Interestingly, analysts also found no correlation between class size and behavioral disruptions. In other words, larger classes were not necessarily more difficult.
Whether teachers who feel valued by society actually teach better is unclear from the survey. But Belanger argues that it’s still important for teachers to feel that their profession is valued. “There’s a bigger picture,” she said. “With TALIS, what we’re trying to do is develop teaching as an attractive profession. If teaching is valued, it’s easier to recruit top candidates into the profession.”
This second TALIS survey was the first year that the United States participated in the OECD teacher survey. For a more detailed report of American teachers, click here.
*The top 10 in math on the most recent PISA test were (1) Shanghai, (2) Singapore, (3) Hong Kong, (4) Taipei, (5) Korea, (6) Macao, (7) Japan, (8) Lichtenstein, (9) Switzerland and (10) the Netherlands. In reading, they were (1) Shanghai, (2) Hong Kong, (3) Singapore, (4) Japan, (5) Korea, (6) Finland, (7) Canada, Ireland, Taipei and (10) Poland. (Canada, Ireland and Taipei had identical scores.)
Related Stories:
PISA math score debate among education experts centers on poverty and teaching
Top US students lag far behind top students around the world in 2012 PISA test results
Top US students decline, bottom students improve on international PISA math test
Study finds taking intro statistics class online does no harm
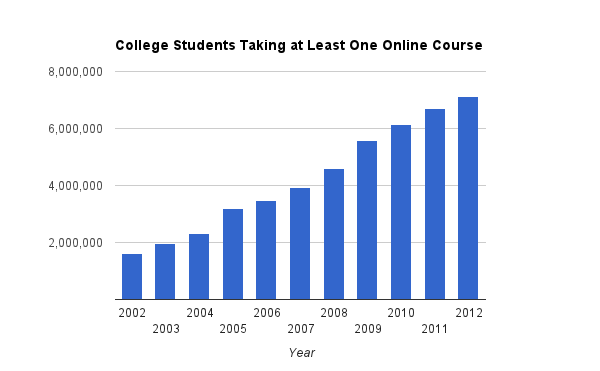
Chart created by Jill Barshay using Google Docs. Source data: Babson Research Group, “Grade Change,” January 2014
Online education has grown so fast that more than a third of all college students — more than 7 million — took at least one course online in 2012. That’s according to the most recent 2014 annual survey by the Babson Research Group, which has been tracking online education growth since 2002. Yet nagging worries remain about whether an online education is a substandard education.
The Babson survey itself noted that even as more students are taking online courses, the growth rate is slowing and some university leaders are becoming more skeptical about how much students are really learning. For example, the percent of academic leaders who say that online education is the same or superior to face-to-face instruction dipped to 74 percent from 77 percent. That was the first reversal in a decade-long trend of rising optimism.
Opinions are one thing, but what do we actually know about online learning outcomes? Unfortunately, there have been thousands of studies, but precious few that meet scientific rigor. One big problem is that not many studies have randomly assigned some students to online courses and others to traditional classes. Without random assignment, it’s quite possible that the kinds of students who choose to take online courses are different from the kinds of students who enroll in traditional courses. Perhaps, for example, students who sign up for online classes are more likely to be motivated autodidacts who would learn more in any environment. Researchers can’t conclude if online learning is better or worse if the student characteristics are different in online courses at the onset.
On June 3, 2014, an important study, “Interactive learning online at public universities: Evidence from a six-campus randomized trial,” published earlier in Journal of Policy Analysis and Management, won the highest rating for scientific rigor from What Works Clearinghouse, a division inside the Department of Education that seeks evidence for which teaching practices work. The study was written by a team of education researchers led by economist William G. Bowen, the former president of Princeton University and the Andrew Mellon Foundation, and Matthew M. Chingos of the Brookings Institution.
The online study looked at more than 600 students who were randomly assigned to introductory statistics classes at six different university campuses. Half took an online stats class developed by Carnegie Mellon University, supplemented by one hour a week of face-to-face time with an instructor. The other half took traditional stats classes that met for three hours a week with an instructor. The authors of the study found that learning outcomes were essentially the same. About 80 percent of the online students passed the course, compared with 76 percent of the face-to-face students, which, allowing for statistical measurement errors, is virtually identical.
The university campuses that participated in the fall 2011 trial were the University at Albany (SUNY), SUNY Institute of Technology, University of Maryland Baltimore County, Towson University (University of Maryland), Baruch College (CUNY) and City College (CUNY).
It’s worth emphasizing that this was not a pure online class, but a hybrid one. One hour a week of face-to-face time with an instructor amounts to a third of the face-to-face time in the control group. Also, the Carnegie Mellon course not only required students to crunch data themselves using a statistical software package, but it also embedded interactive assessments into each instructional activity. The software gives feedback to both the student and the instructor to let them know how well the student understood each concept. However, the Carnegie Mellon software didn’t tailor instruction for each student. For example, if students answered questions incorrectly, the software didn’t direct them to extra practice problems or reading.
“We believe it is an early representative of what will likely be a wave of even more sophisticated systems in the not-distant future,” the authors wrote.
The Department of Education reviewed only the analysis of passing rates in the Carnegie Mellon stats class trial. But Bowen and the study’s authors went further, and found that final exam scores and performance on a standardized assessment of statistical literacy were also similar between the students who took the class in person and online. They also conducted several speculative cost simulations and found that hybrid models of instruction could save universities a lot of money in instructor costs in large introductory courses in the long run.
But in the end, the authors offer this sobering conclusion:
In the case of a topic as active as online learning, where millions of dollars are being invested by a wide variety of entities, we might expect inflated claims of spectacular successes. The findings in this study warn against too much hype. To the best of our knowledge, there is no compelling evidence that online learning systems available today—not even highly interactive systems, of which there are very few—can in fact deliver improved educational outcomes across the board, at scale, on campuses other than the one where the system was born, and on a sustainable basis. This is not to deny, however, that these systems have great potential. Vigorous efforts should be made to continue to explore and assess uses of both the relatively simple systems that are proliferating, often to good effect, and more sophisticated systems that are still in their infancy. There is every reason to expect these systems to improve over time, and thus it is not unreasonable to speculate that learning outcomes will also improve.
Measuring the cost of federal student loans to taxpayers

Cost of Federal Student Loan Programs 2015-2024. Source: CBO May 2014
Soaring student loan debt seems to be the next crisis waiting to explode. Universities keep jacking up their tuition and the U.S. government keeps financing it through a seemingly unlimited supply of student loans. As I’ve written before, student loans exceed $1 trillion and more than 11 percent of student loan balances are 90+ days delinquent or in default. When will student loan defaults, already the highest of any consumer loan category, simply get too high that politicians put the brakes on this lending machine?
I suspect one of the reasons that there hasn’t been more pressure in Washington to address student debt is that the federal student loan program is a profit center on the U.S. government’s official ledger books. The Congressional Budget Office (CBO) says that the four main student loan programs are expected to generate $135 billion in profit over the ten years from 2015-2024 (see here). It does that by making a lot of assumptions. Basically, it is guessing that more than enough students will pay back their loans, plus interest, over the next 30 years to more than offset all the loans that aren’t repaid. And it books those future cash flows as profits today.
The problem is that this profit may be no more than an accounting sleight-of-hand. In the same document, dated May 2014, the CBO explains that if it discounted future cash flows at a higher rate, using the same accounting methods that private banks use on their loans, then these profits would instantly vanish and turn into a tax-payer loss of $88 billion.
The non-partisan CBO has been arguing for years that it should use a higher discount rate because it would reflect market risks. Currently it discounts future cash flows by the yield on Treasuries, which is such a safe investment, that it effectively assumes that the economy will never go into a recession. What if the economy tanks and fewer students can get jobs and can’t repay their loans? Right now, the accounting assumptions don’t factor that possibility in.
This article also appeared here.
In this case, the CBO’s hands are tied. Despite its desire to use more realistic accounting assumptions, the CBO is bound by a 1990 Congressional statute, the Federal Credit Reform Act (FCRA), to use the outmoded discount rate. It would take Congressional action to change that. (The chart on the right here shows the difference in costs. The big dark bar shows the $135 negative cost, or profit, by using the current FCRA methodology. The light bar shows a positive cost of $88 billion if a higher discount rate, known as fair-value accounting, were used.)
The CBO also points out that regardless of which accounting figure you believe in, neither the $135 billion profit figure nor the $88 billion loss factors in administrative costs. That’s the cost of issuing loans, tracking down students after graduation and collecting their monthly payments. Jason Delisle of the New America Foundation dug into federal budget documents and found that the administrative cost amounts to 1.7% of loan issuance. That’s a reasonable figure for overhead. But when you multiply that by the $650 billion dollars in undergraduate loans that the government expects to issue, suddenly profits turn into losses. Delisle calculates that the undergraduate lending program will cost taxpayers $16.7 billion even using the government’s inflated accounting figures.
“Officially then, federal loans to undergraduates, even using official government cost estimates, are made at a cost to taxpayers, not a profit as some claim,” Deslisle wrote.
Controversial data-driven research behind the California court’s decision to reject teacher tenure
Underlying the California court’s decision on June 10, 2014 to reject teacher tenure as unconstitutional is a controversial body of academic research on teacher effectiveness. The argument that won out was that tenure rules often force school districts to retain their worst teachers. Those ineffective teachers tend to end up at the least desirable schools that are packed with low-income and minority students. As a result, teacher tenure ends up harming low-income students who don’t have the same access as rich students to high-quality teaching.
But for this argument to carry weight we have to be able to distinguish good teachers from bad. How can we prove that California’s low-income schools are filled with teachers who are inferior to the teachers at high-income schools?

The nine plaintiffs, including Beatriz Vergara, who brought suit against the state. This slide, without names, was shown in court.
Dan Goldhaber, a labor economist at the University of Washington, and Eric Hanushek, a senior fellow at the Hoover Institution at Stanford, were two of the expert witnesses who spoke against teacher tenure in Vegara v. California. Both employ quantitative economic analysis in the field of education. They are both big proponents of using value-added measures to determine who is an effective teacher.
In value-added analysis, you begin by creating a model that calculates how much kids’ test scores, on average, increase each year. (Test score year 2 minus test score year 1). Then you give a high score to teachers who have students who post test-score gains above the average. And you give a low score to teachers whose students show smaller test-score gains. There are lots of mathematical tweaks, but the general idea is to build a model that answers this question: are the students of this particular teacher learning more or less than you expect them to?
This article also appeared here.
Indeed, researchers using this value-added measure approach have sometimes found low-income schools have a high number of teachers who teach students with below-average test score gains.
Many researchers are questioning whether test-score gains are a good measure of teacher effectiveness. Part of the problem are the standardized tests themselves. In some cases, there are ceiling effects where bright students are already scoring near the top and can’t show huge gains year after year. In other cases, struggling students may be learning two years of math in one year, say catching up from a 2nd grade to a 4th grade math level. But the 5th grade test questions can’t capture the gains of kids who are behind. The test instead concludes that the kids have learned nothing. In both of these cases, with top and bottom students, the teachers would be labeled as ineffective.
Morgan Polikoff of the University of Southern California and Andrew Porter of the University of Pennsylvania looked at these value-added measures in six districts around the nation and found that there was weak to zero relationship between these new numbers and the content or quality of the teacher’s instruction. Their research was published in May 2014, after the Vegara trial ended.
National student database controversy heats up again
This Inside Higher Ed piece by Libby Nelson explains the new push in Washington to create a national student database that would track students through college and into the work force. The idea, sometimes referred to as a “unit record data,” was originally proposed by the Bush Administration in 2005, but critics, citing student privacy concerns, were able to kill it.
“In the past seven years, the voices calling for a unit record system have only intensified; there is now a near-consensus that a unit record system would be a boon for higher education policy makers, by tracking the flow of individual students into and out of colleges.”
A similar student privacy debate is playing out again. See this opinion piece opposing a new database, arguing, in part, that prospective employers could request to see these new student records. This blog post argues that this kind of student privacy criticism is “moot” because employers can already request to see transcripts.
Poverty among school-age children increases by 40 percent since 2000
National Center for Education Statistics, The Condition of Education 2014
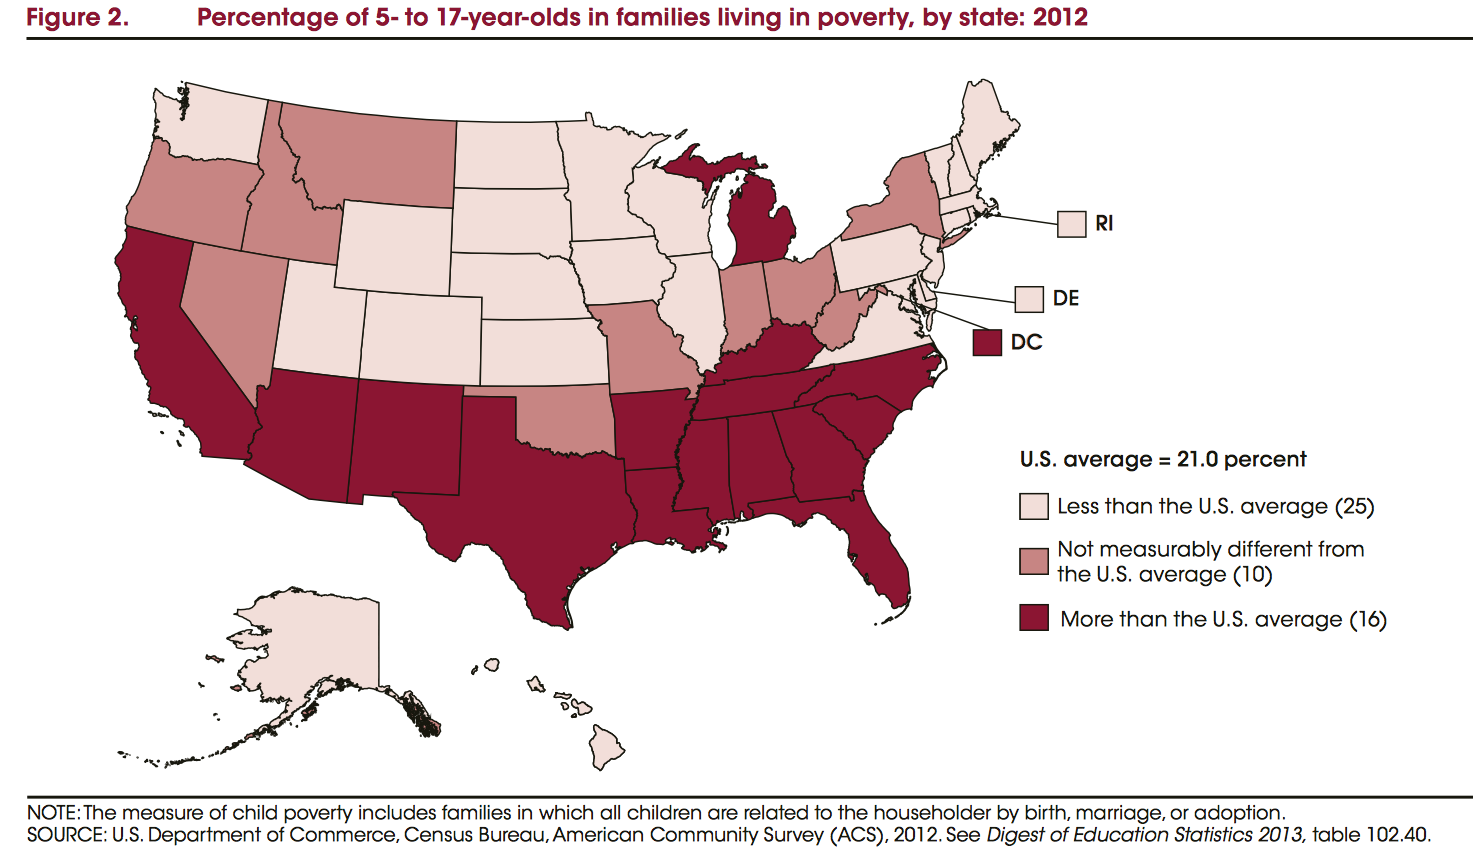
One in five school-age children lived in poverty in 2012, compared to about one in seven children back in 2000. That’s a 40 percent jump in child poverty in the last dozen years. A household of four people with less than $23,283 in income in 2012 was defined by the Census Department as poor.
This data comes from the latest annual report, “The Condition of Education 2014,” published by the National Center for Education Statistics on May 29, 2014.
The child poverty rate had been declining in the 1990s, but has taken a turn for the worse since 2000.
There is a striking north-south divide when it comes to child poverty. Southern states tend to have more than 21 percent of their school age children living in poverty. Northern states tend to have fewer. Michigan is the only northern state to have this kind of severe child poverty. (Washington DC’s child poverty rate exceeds 21 percent as well). Click on the map for a larger image.
When you break the data down by race and family structure, there are other striking patterns. Almost 40 percent of all black children under 18 are living in poverty, compared with 33 percent of Hispanic children. Whites and Asians have a similar child poverty rate of 13 percent and 14 percent, respectively. But the high poverty rate is clearly intertwined with family structure. Only 15 percent of black children who live in a married-couple household live in poverty, compared with 53 of black children in a mother-only household. But poverty is stubbornly high even in married Hispanic households; 22 percent of Hispanic children who live in married-couple households are poor.
Princeton undergraduate finds no improvement in student performance at California charter schools after converting to blended learning
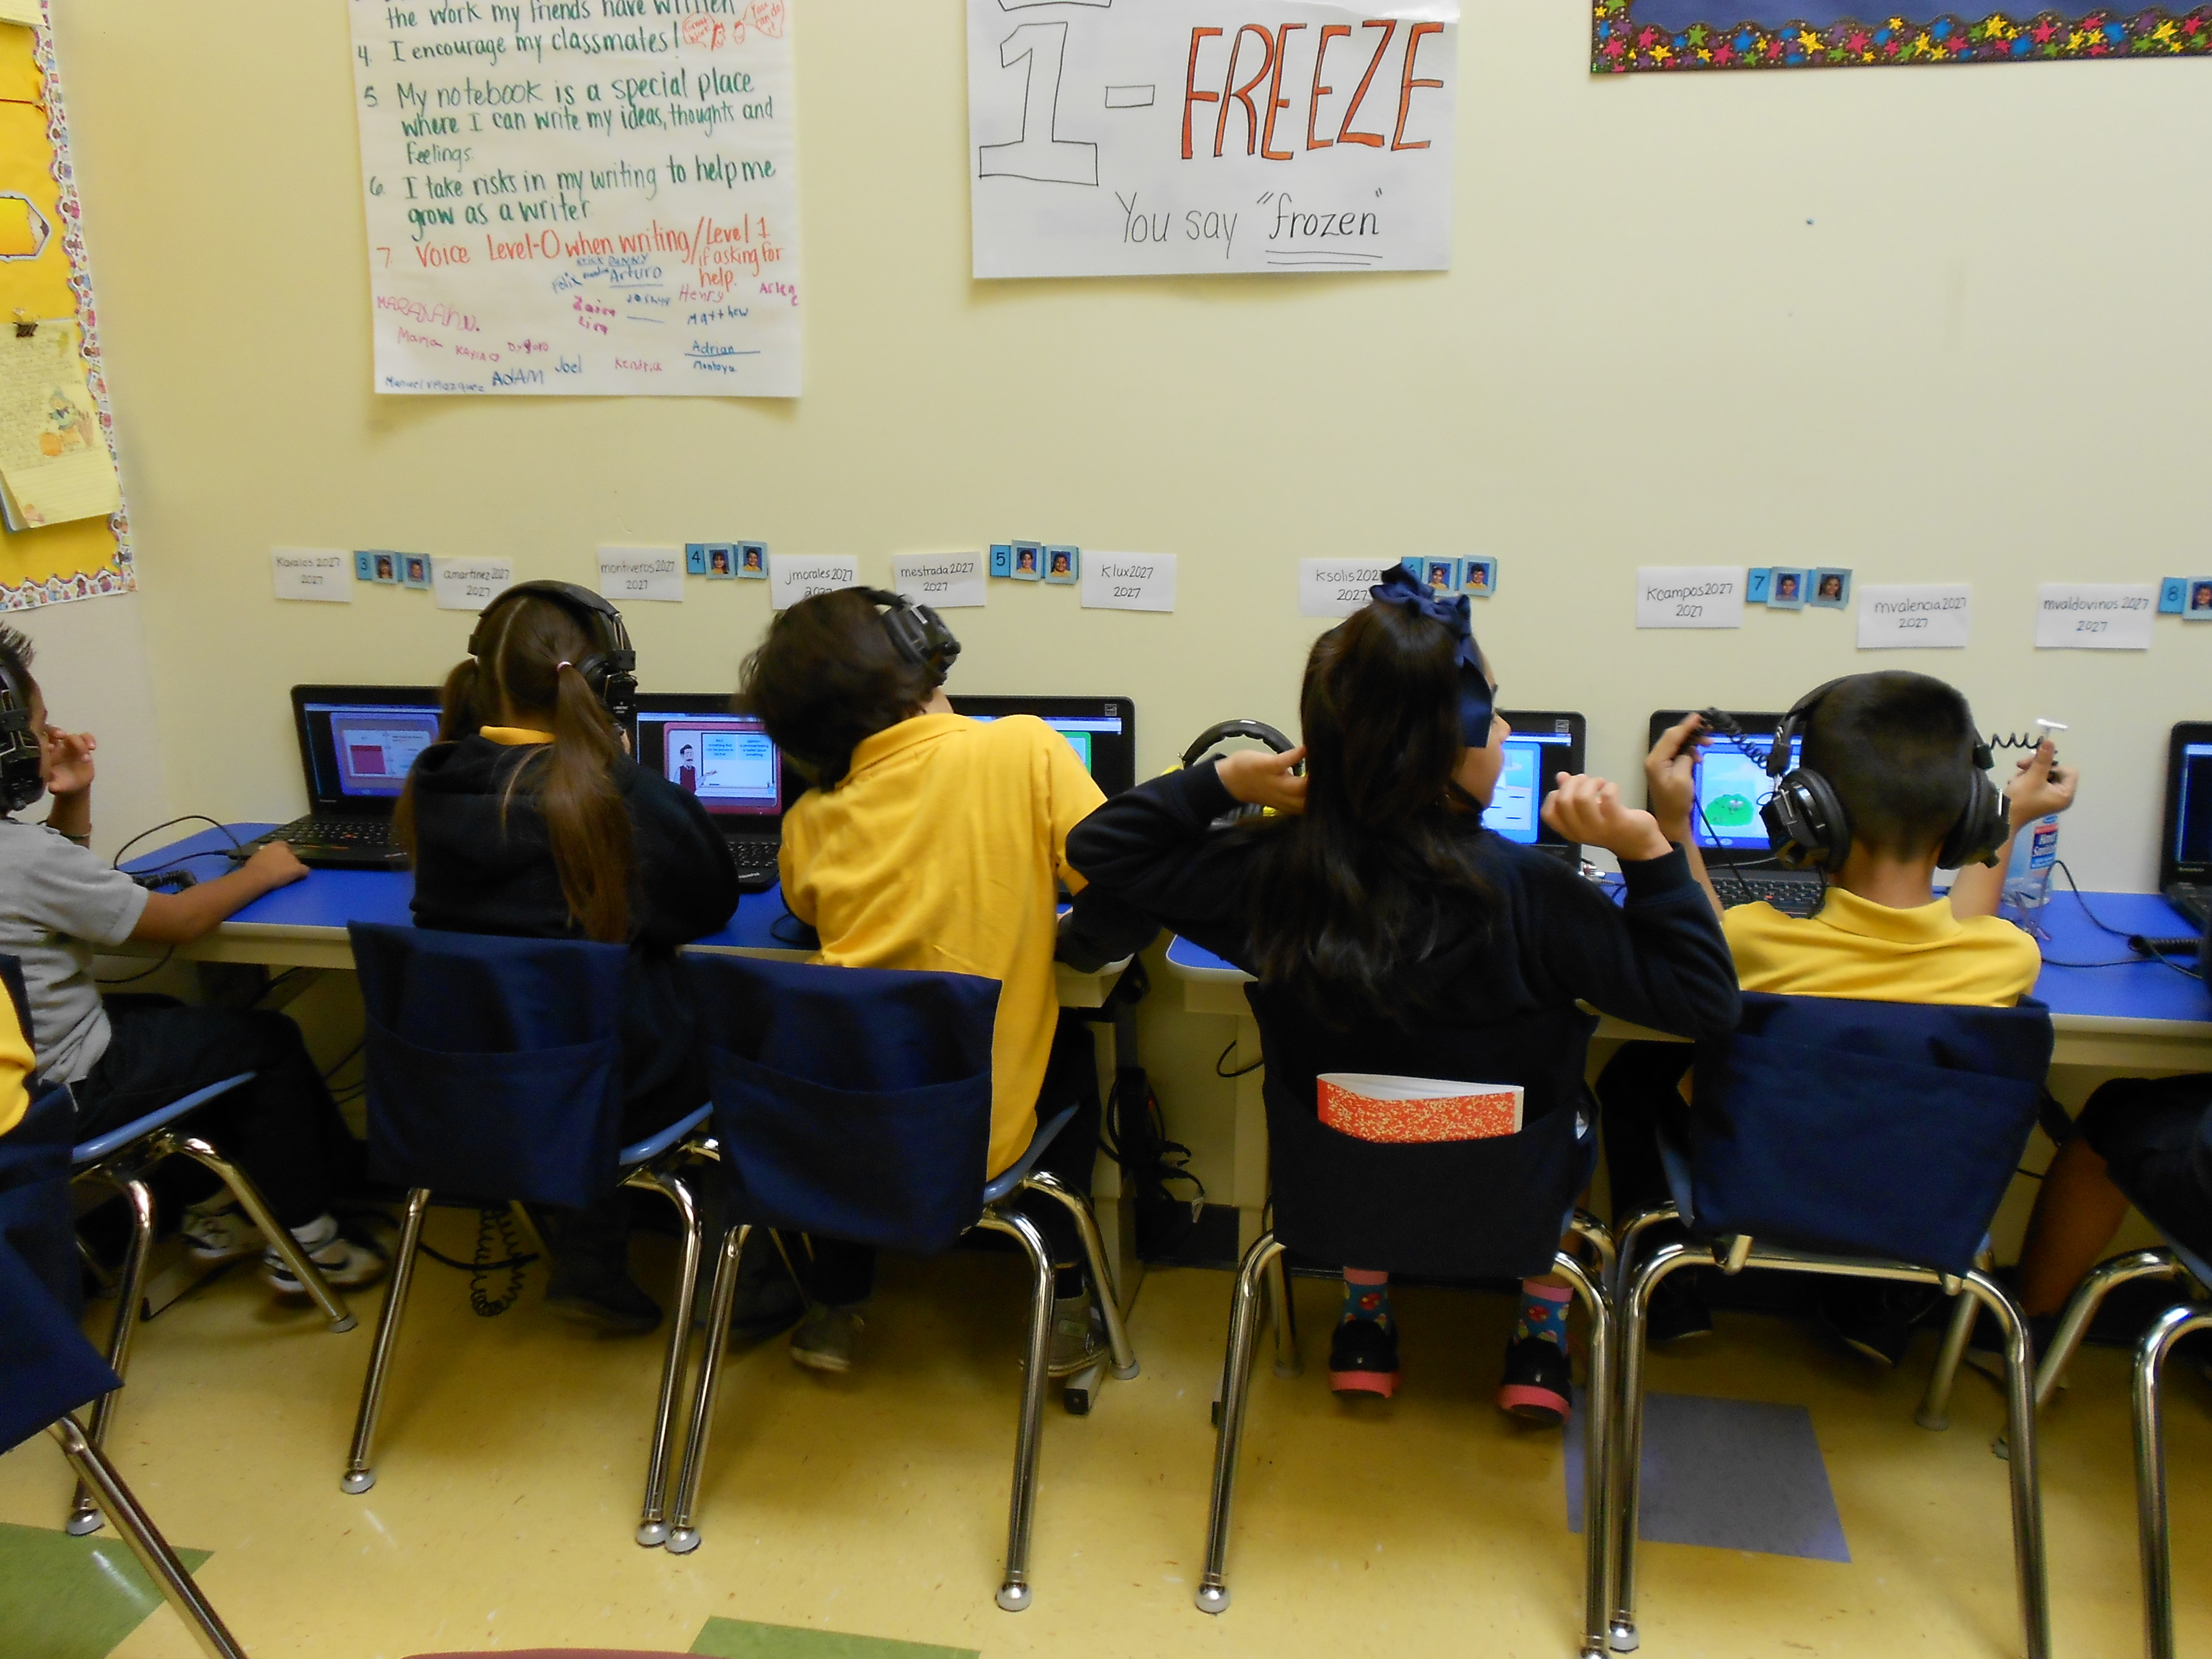
Third-grade students at Aspire Titan Academy work independently online for about 90 minutes a day. (Photo: Margaret Ramirez)
Many schools across the country are experimenting with blended learning, where students are taught by a combination of computers and human teachers, but it is such a new phenomenon that there is little empirical evidence to prove that students learn more this way.
One Princeton undergraduate looked at the test scores of 35 California schools that are using a so-called “rotation” model, where students rotate between computers and teacher-led instruction throughout the day. Laura Du’s empirical paper, “The Potential of K-12 Blended Learning: Preliminary Evidence From California Schools,” found that these schools produced significantly higher test score gains than traditional schools who serve a similar demographic. These gains were equivalent to the difference between two achievement levels, such as “below basic” vs. “basic” on California assessments. In her analysis, Du matched each blended-learning school with a similar traditional school and compared test scores. Du also discussed her research here on EdSurge.
The problem is that many of the blended-learning schools in the study are charter schools. They included schools run by Aspire, Rocketship Education, Summit, Alliance College-Ready Public Schools and KIPP. Du’s matching analysis doesn’t account for the likelihood that students who attend charter schools come from more motivated families and would be likely to learn more in any setting. It’s quite possible that Aspire’s blended learning model produces better results not because it’s using computers, but because it has better students entering its classrooms than the regular public school down the street.
To control for this difference in student motivation, Du also looked at schools that had converted from traditional instruction to blended-learning. She found no difference in student performance before and after the conversion. She also compared schools operated by charter management organizations that ran both blended and non-blended schools within the same district, such as KIPP, Aspire, and Alliance. Again, she found no statistical difference in student performance.
To my mind, the failure to find meaningful differences in student performance between charter schools that do and don’t use computerized learning is significant. But it’s also fair to say that it’s premature to say whether blended learning works or not. Teachers are still experimenting with different ways to do it. Educational software companies are at the early stages of producing computerized instruction. Even if some version of computerized instruction does produce great results, it may take many years to figure it out.
The Hechinger Report’s coverage on digital education is here.
Related stories:
Study shows that high-tech schools run into budget troubles and cut tech spending
Can technology improve preschool? Louisiana teachers are about to find out
Instead of getting ready for the tech revolution, schools are scaling back
Study shows that high-tech schools run into budget troubles and cut tech spending
Preliminary findings from a two-year study of new charter schools that were given extra funds to combine computer-based learning with teacher instruction show that schools quickly ran into budget shortfalls and pulled back on their technology plans. The study was written by the Center on Reinventing Public Education at the University of Washington and published on May 28, 2014.
Budget shortfalls arose almost immediately because charter school leaders were overly optimistic about the number of students they could recruit to their new high-tech schools. Since a large chunk of a charter’s revenue comes from the per-student fees they receive from the public school district or state, the shortage of students left many charters far short of the revenues they had projected. School leaders typically ended up spending more on staff and less on technology than they originally planned. The eight schools in this study spent a total of only $650,000 on technology, 60 percent less than $1.7 million originally budgeted.
The report concluded that five of eight schools “may not be on track to realize the full promise of technology-enhanced classrooms.”
In the report, one school had purchased only 20 computers for a classroom of 37 students. Another school eliminated a centralized data dashboard and teachers couldn’t view student performance data in one place.
The schools in the study each received grants averaging more than $300,000 from The Bill & Melinda Gates Foundation and the William and Flora Hewlett Foundation to start schools that would emphasize computer instruction tailored to each student’s needs. This CRPE study, looking at how these schools are faring, was also financed by the Gates Foundation. The Gates Foundation is among the funders of The Hechinger Report, which publishes this blog.
Are schools more segregated than in the 50s? What does the data say?
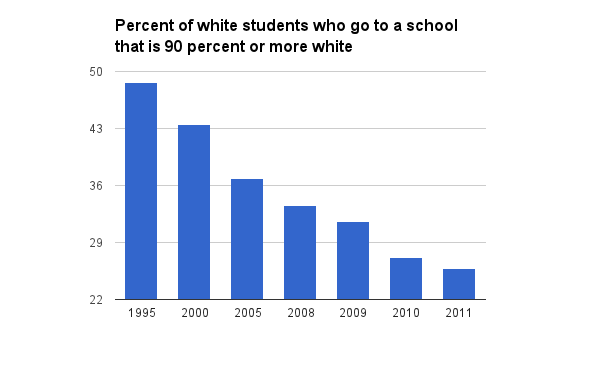
Data Source: NCES
Conventional wisdom in education circles is that school segregation is worse today than before the Supreme Court ruled in 1954 that separate schools for whites and blacks were unconstitutional. Many in media are citing statistics from a May 2014 report from the Civil Rights Project at UCLA. Slate’s Jamelle Bouie wrote that it shows, “minority students across the country are more likely to attend majority-minority schools than they were a generation ago.”
But federal data from the National Center of Education Statistics (NCES) don’t entirely support this narrative that segregation is getting worse.
Specifically, this table shows that about 49 percent of white students attended a school that was 90 percent or more white back in 1995, the oldest data in these tables. In the most recent data for 2011, only 26 percent of white students attended a school that was 90 percent or more white. That’s a huge drop. Whites are much more likely to be going to schools with some level of integration.
Black students were also less likely to go to an all black school in 2011 than they were in 1995. In 1995, 22 percent of blacks attended a school that was 90 percent or more black. In 2011, 17 percent attended a school that was 90 percent or more black. That’s a 4 percentage point drop in blacks who go to schools that are all or almost all black.
For Hispanics, whose population is soaring, it’s a different story. About 15 percent of Hispanic children attended a school that was 90 percent or more Hispanic in 1995. That grew to 17 percent of Hispanic students in 2011. But the peak was actually in 2008 and this kind of intense segregation of Hispanic students seems to be stabilizing.
Others have noticed the increased prevalence of schools dominated by low-income blacks and Hispanics. Perhaps blacks are not more likely to go to a black-only school, but a school that has only blacks and Hispanics? The NCES data doesn’t tabulate which schools are more than 90 black and Hispanic, but it does tabulate which schools are more than 90 minority. However, this minority data counts all minorities, including Asian students.
This table shows that 34 percent of blacks attended a school that was 90 percent or more minority in 1995. That rose a lot by 2011. More than 39 percent go black children attended a school that was 90 percent or more minority. There was a similar jump for Hispanic students. About 35 percent attended a school that was 90 percent or more minority in 1995. More than 41 percent of Hispanics were attending this kind of school in 2011.
Interestingly, the numbers are also going up for whites and Asians. Even white students are more likely to be attending a school that is 90 percent or more minority today than they were in 1995. Everyone is more likely to be in a school with more minorities.
Whites are no longer in the majority in the U.S. school system (see this post). If we lived in an ideal society with perfect integration, all of our schools would indeed be majority minority going forward. And so declaring that minorities are more likely to be going to a school that has 50 percent or more minorities doesn’t indicate increased segregation.
It’s obviously not a good sign when the percentage is rising of Hispanics and blacks who are going to schools that are 90 percent or more minority. What other kinds of data thresholds should we use to demonstrate segregation?
NCES Data sources:
Percentage of each racial/ethnic group by the percentage of their own racial/ethnic group in the school. http://nces.ed.gov/programs/
Percentage of each racial/ethnic group by the percent of minorities in that school. http://nces.ed.gov/programs/
Related stories:
White students predicted to be in the minority in U.S. public schools by fall 2014
