Private schools decrease by 7.5 percent
Fewer students are enrolled in private schools and there are fewer private schools in the United States than there were two years ago. That’s according to the latest private school data, released on July 9, 2013 by the National Center for Education Statistics.
In the fall of 2011, there were 30,861 private elementary and secondary schools , a 7.5 percent drop from the last time the NCES counted in 2009. The number of students in private schools dropped 4.4 percent during the same two-year time period to 4,494,845 students.
What accounts for the decline? Is it the 2008 recession? Or the shrinking of the Catholic Church’s parochial schools? Or a combination of both?
Unfortunately, it’s not easy to look at changes over time and speculate about the answers to these questions. You have to download each biennial report to compare numbers. But you could go back as far as 1989, when the NCES, in conjunction with the U.S. Census Department, began collecting this data. (I looked at the 2011-12 and the 2009-10 reports just to calculate the headline numbers above).
For the fun of it, I quickly checked the 2007 private school numbers and I saw that there were 33,740 private schools that year, very close to the 33,366 recorded in 2009. That confirms that the 7.5 decline is a new phenomenon.
Table 1 of both reports shows that all kinds of private schools are declining, both Catholic and non-sectarian independent schools. Even Montessori schools are closing. The smallest schools, those with fewer than 50 students, were the hardest hit with 11 percent of them disappearing between 2009 and 2011.
One type of private school, however, is becoming more popular and expanding: private schools that cater to students with disabilities and special needs.
Small liberal arts schools tend to be more expensive
I was just playing around with the recently updated data on the College Affordability and Transparency Center, and I was struck by how many smaller liberal arts colleges are among the most expensive four-year private non-profit institutions. I expected to see more universities with expensive graduate departments and science labs.
To be sure, Columbia University tops the list with annual tuition and required fees of $45,290 during the 2011-12 school year. That might be expected with the high cost of real estate and salaries in New York City. But seven of the top 10 most expensive schools are small liberal arts colleges: Sarah Lawrence, Vassar, Trinity, Connecticut College, Wesleyan, Bucknell and Bard College at Simon’s Rock in Great Barrington, Mass.
On the other hand, these bucolic colleges are not so much more expensive than urban universities. University of Chicago at $43,780 is nearly as pricey.
Here’s the list of the 65 most expensive four-year colleges and universities:
| U.S. Department of Education | |||
| Private not-for-profit, 4-year or above with Highest Tuition | |||
| (National Average: $22,786) | |||
| Institution | State | Tuition(1) | |
| Columbia University in the City of New York | NY | $45,290 | |
| Sarah Lawrence College | NY | $45,212 | |
| Vassar College | NY | $44,705 | |
| George Washington University | DC | $44,148 | |
| Trinity College | CT | $44,070 | |
| Carnegie Mellon University | PA | $44,010 | |
| Connecticut College | CT | $43,990 | |
| Wesleyan University | CT | $43,974 | |
| Bucknell University | PA | $43,866 | |
| Bard College at Simon’s Rock | MA | $43,840 | |
| University of Chicago | IL | $43,780 | |
| St John’s College | MD | $43,656 | |
| St John’s College | NM | $43,655 | |
| Union College | NY | $43,602 | |
| Tulane University of Louisiana | LA | $43,434 | |
| Bard College | NY | $43,306 | |
| Oberlin College | OH | $43,210 | |
| Williams College | MA | $43,190 | |
| University of Richmond | VA | $43,170 | |
| Dickinson College | PA | $43,060 | |
| Dartmouth College | NH | $42,996 | |
| Tufts University | MA | $42,962 | |
| Carleton College | MN | $42,942 | |
| Colgate University | NY | $42,920 | |
| Hobart William Smith Colleges | NY | $42,915 | |
| Hampshire College | MA | $42,900 | |
| Amherst College | MA | $42,898 | |
| Occidental College | CA | $42,871 | |
| Colby College | ME | $42,820 | |
| University of Southern California | CA | $42,818 | |
| Bowdoin College | ME | $42,816 | |
| Bates College | ME | $42,800 | |
| Bennington College | VT | $42,800 | |
| Reed College | OR | $42,800 | |
| St Lawrence University | NY | $42,735 | |
| Rensselaer Polytechnic Institute | NY | $42,704 | |
| Hamilton College | NY | $42,640 | |
| Kenyon College | OH | $42,630 | |
| Franklin and Marshall College | PA | $42,610 | |
| Gettysburg College | PA | $42,610 | |
| Pitzer College | CA | $42,550 | |
| Middlebury College | VT | $42,428 | |
| Harvey Mudd College | CA | $42,410 | |
| Skidmore College | NY | $42,380 | |
| Johns Hopkins University | MD | $42,280 | |
| Claremont McKenna College | CA | $42,240 | |
| Brown University | RI | $42,230 | |
| Haverford College | PA | $42,208 | |
| Boston College | MA | $42,204 | |
| Barnard College | NY | $42,184 | |
| University of Pennsylvania | PA | $42,098 | |
| Macalester College | MN | $42,021 | |
| Washington University in St Louis | MO | $41,992 | |
| Northwestern University | IL | $41,983 | |
| Franklin W. Olin College of Engineering | MA | $41,950 | |
| Scripps College | CA | $41,950 | |
| Duke University | NC | $41,938 | |
| Washington and Lee University | VA | $41,927 | |
| Wheaton College | MA | $41,894 | |
| Brandeis University | MA | $41,860 | |
| University of Rochester | NY | $41,826 | |
| Ursinus College | PA | $41,820 | |
| Stevens Institute of Technology | NJ | $41,782 | |
| New York University | NY | $41,606 | |
| Wake Forest University | NC | $41,576 | |
|
(1)Tuition and Required Fees, 2011-12
|
|||
|
SOURCE: U.S. Department of Education, National Center for Education Statistics, Integrated Postsecondary Education Data System (IPEDS), Fall 2011, Institutional Characteristics component and Spring 2012, Student Financial Aid component.
|
|||
High student loan default rates among largest community colleges
I decided to do a little data mashup of Community College Week’s 2013 list of the top community colleges, published on June 24, 2013, and the federal student aid database of default rates. Here is a list of the top 10 producers of associates degrees and their average default rate on student loans over the past three years.
| Rank | 2013 top producers of 2-year associates degrees | FY 09 3-year default rate |
| 1 | Ivy Tech Community College, Ind. | 20.2% |
| 2 | Northern Virginia Community College, Va. | 12.3% |
| 3 | Lone Star College System, Tex. | 17.7% |
| 4 | Houston Community College, Tex. | 21.9% |
| 5 | Hillsborough Community College, Fla. | 16.3% |
| 6 | El Paso Community College, Tex. | 14.7% |
| 7 | Salt Lake Community College, Utah | 10.6% |
| 8 | Suffolk County Community College, NY | 16.4% |
| 9 | Tarrant County College District, Tex. | 16.3% |
| 10 | Tallahassee Community College, Fla. | 25.9% |
Ivy Tech produced almost 9,000 associates degrees. And based on recent history, more than 1800 of these students will likely default on their federal student loans. Salt Lake Community College, at number seven, generates lot of diplomas too, but they’ve managed to keep their default rate closer to a respectable 10 percent.
Tallahassee Community College, at number 10, is in danger of losing its eligibility for federal student loans with its default rate topping 25 percent.
Teens read less today than 30 years ago, national data show
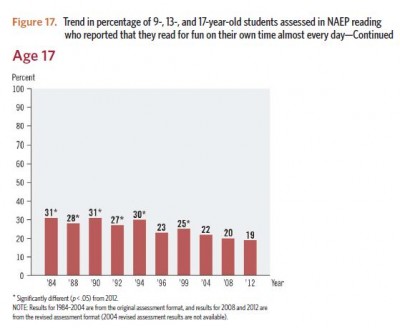
Here’s a bit of data that confirms what we already suspect. According to a 2012 survey by the National Assessment of Educational Progress (NAEP), fewer than 20 percent of 17-year-old high school students (19 percent to be exact) say that they read for fun on their own time almost every day. That is the lowest percentage since NAEP began asking that question to U.S. elementary, middle and high school students. Back in 1984, more than 30 percent of 17 year olds said they read for fun every day.
For charts and tables, see pages 24 through 27 in the NAEP 2012 Trends in Academic Progress Report, released on June 27, 2013.
The same downward trend is true for 13 year olds with just 27 percent reading on their own these days, compared with 35 percent back in 1984. Thank the Lord for Harry Potter and JK Rowling’s grip on nine year olds. Fifty three percent of nine year olds said they read for fun in 2012, no drop at all since 1984.
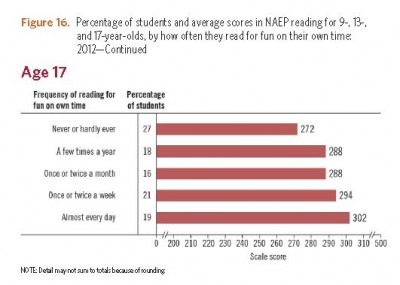
The decline in reading matters. According to NAEP, the kids with the highest test scores in reading also report reading the most. For example, 17 year olds who say they read for fun almost every day scored 11 percent higher, on average, than 17 year olds who admit that they don’t read for fun. Among nine year olds, those who say they read for fun almost every day scored almost 9 percent higher than those who admit that they don’t read for fun.
The NAEP report also breaks this reading data down by race. At age 13 and 17, higher percentages of whites than blacks or Hispanics report that they read for fun almost every day. For example, 22 percent of white students report that they read daily, compared with 17 percent of black students and 15 percent of Hispanic students.
But nine year olds are a different matter. Hispanic nine year olds are as voracious readers as white nine year olds (52 percent and 53 percent say they read every day for fun, respectively).
NAEP doesn’t explain the decline in reading among teens. It seems obvious to jump to the conclusion that teens are playing more games and texting on their iPhones than reading books. I certainly see that on the New York City subway. But aren’t nine year olds playing video games too? Why hasn’t their reading suffered?
Achievement gap between minorities and whites is closing; gender gaps narrow too
Black and Hispanic students posted much larger gains than white students over the past 40 years on the long-term National Assessment of Education Progress test, which I first wrote about on June 27, 2013.
“The improvement and gap closing is not just a theoretical possibility, but it is happening,” said Kati Haycock, president of the Education Trust, which advocates for closing the achievement gap. Haycock put together a great packet of slides and tables, precisely detailing the closing of the gap.
I’ll just highlight a few things here:
1) The White –Black score gaps in reading for 9- and 17-year-olds in 2012 were nearly half the size of the gaps in 1971. Nonetheless, the White-Black gap is still large. That is, whites are still scoring much higher than blacks are at each age (9, 13 and 17). The White-Black gap in math also narrowed, but not by nearly as much.
2) Haycock points out that minority progress has slowed and in some cases stalled in the past two decades. In her reading of the data, she said that the largest gains for minorities took place in the 70s and 80s, when new education initiatives and funding helped to bolster minority achievement. “We need to pick up the pace,” she said.
4) The math gender gap has disappeared for nine and 13 year olds. Boys are still stronger at math at age 17. But even that gap has narrowed because 17-year-old girls are posting stronger math scores.
3) Female superiority at reading still holds at every age (9, 13 and 17). But among nine year olds, the gender gap narrowed by more than half from 13 to 5 points, largely because nine year old boys are reading much better today than they were in 1971. There was no improvement in the gender gap for older ages.
High school test scores haven’t improved for 40 years; top students stagnating
Is U.S. high school a wasteland? Or are teenagers getting a better education today than they were 40 years ago? That’s a puzzle offered in a release of national test scores on June 27, 2013 by the National Center of Education Statistics.
According to the National Assessment of Educational Progress (NAEP), test scores for 17 year olds have not improved since the early 1970s. That is, the average 17 year old in 2012 got about the same score in reading and math (287 and 306, respectively) as a 17 year old in 1971 or 1973 did (285 and 304, respectively). Scores have bobbled up and down a point or two over the years, but, statistically speaking, they’ve been indistinguishable from each other. (These scaled score numbers are arbitrary, but think of them like SAT scores. A difference between, say, a 580 and a 590 on a math SAT isn’t huge. And the difference between 285 and a 290 on this NAEP test is also tiny).
While 17 year olds have flatlined, both nine and 13 year olds have shown statistically meaningful progress during this same 40-year time period. So, you can’t explain it by the changing racial/ethnic demographics in our country. (Back in 1971, 80 percent of U.S. students were white, compared with 56 percent in 2012. The Hispanic population soared from 6 percent to 21 percent).
So the question is, what’s going on — or not going on — in high school?
“We’re all concerned with these high school students,” said Dr. Peggy Carr, the associate commissioner of NCES. “The pattern is clear…younger students are showing stronger gains.”
One answer offered by Carr is that high school drop out rates have plummeted and that means that we’re not comparing the same group of students. Dr. Carr particularly pointed to the Hispanic drop out rate, which more than halved from 32 percent in 1990 to 15 percent in 2010. That means that the weakest teenagers who weren’t even part of the testing pool in 1971 because they’d dropped out of school are now staying in school. Their low test scores might be bringing down an average that would otherwise have been higher.
Carr argues that flat scores aren’t terrible. “It’s a good thing that they’re not going down,” she said.
You can test that hypothesis by looking at NAEP’s breakdown of scores by percentiles. If the dropout theory holds water, then students who score in the middle and top should have been showing improvements over the past 40 years just like the nine and 13 year olds.
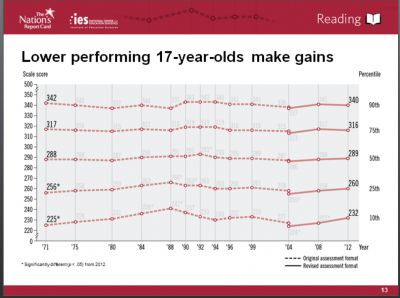
Instead, we see stagnation at the middle and the top. All the gains are among the bottom students. (Click on the chart below to see a larger version.)
For example, a student who ranked at the top 90th percentile in 1971 had a reading score of 342. In 2012 his reading score was 340 — statistically identical. The same is true for students at the 75th and 50th percentiles. You only see long-term gains among students at the bottom 10th and 25th.
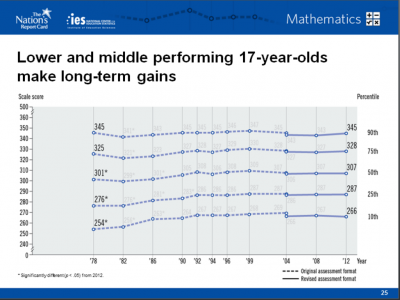
There’s a similar story in math. The bottom students are showing the biggest gains, and here, the middle students show a bit of improvement. But no improvement among the top kids.
So, we seem to be doing a decent job of starting to close the achievement gap, but perhaps at a cost of not propelling our best students. Perhaps high school is a wasteland for them? We’re not just talking public schools. This long-term NAEP test is a statistically representative sample of students in the entire nation, including the wealthiest children who attend private schools.
Back in May 2013 I attended a seminar by Martin Carnoy of Stanford University, who was analyzing different international data. But his conclusion was the same. “The problem is at the top,” he said. “U.S. top students are way behind top students in other countries.”
Education might be the next weight loss fad; obesity rate much lower among college grads
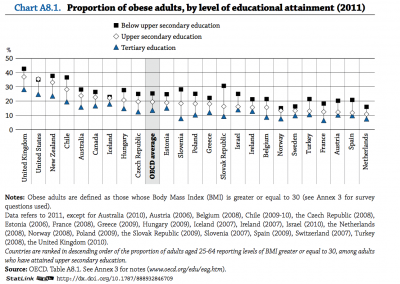
The obesity rate among college graduates is significantly lower than for high school drop outs or those with only a high school degree. This obesity gap exists not only in the United States, but also in 23 other countries around the world, according to a new data report, Education at a Glance 2013, by the Organization for Economic Co-operation and Development (OECD) released on June 25, 2013.
On average across the 24 OECD countries, approximately 19 percent of adults are obese. But among those with a college education, the obesity rate is only 13 percent. For high school drop outs, the obesity rate is 25 percent.
Obesity rates vary quite a bit by country. And the differences are more startling in the countries with the highest rates of obesity. For example, the United Kingdom shows a 15 percentage point gap in obesity between those who have a college education (fewer than 30% of UK college grads are obese) and those that didn’t complete high school (more than 40% of UK high school dropouts are obese). In the United States, more than 30 percent of the population is obese. But fewer than 25% of college grads are obese compared with more than 35 percent of Americans with only high school diplomas or less. That’s a 10 percentage point gap.
The gap is even steeper among women: 16 percentage points. That is, the obesity rate among educated women is much lower than for uneducated women. Among men, the education differential in obesity is only 7 percentage points.
Andreas Schleicher of the OECD cautioned against jumping to the conclusion that education makes people thinner. “We don’t understand the causal nature,” he said. It may be that people who exercise and eat with moderation also tend to choose to go college.
Click on the chart to see a larger version
(Source: OECD Education at a Glance 2013 p.148 for chart A8.1 and p. 154 for table A8.1)
Oops. Story corrected to clarify that fewer than 30% of UK college grads are obese, not more than 30%.
More college degrees and higher pay among daycare workers, nannies and early childhood educators, says study.
The people who take care of our littlest children are better educated than they used to be and are seeing their paychecks rise. They’re also staying in the profession longer than childcare workers had in the past. That’s according to a paper, “The early childhood care and education workforce from 1990 through 2010: Changing dynamics and persistent concerns,” to be published in Education Finance and Policy by Daphna Bassok, Maria Fitzpatrick, Susanna Loeb, Agustina S. Paglayan.
To be sure, childcare workers are still some of the lowest paid and least educated workers in the country. But this is the first data analysis to show marked improvement and contradicts other studies that have shown the quality of childcare workers has continued to decline.
What makes this study different is that the authors were able to include childcare workers who work inside a home, such as an Upper East Side Manhattan nanny, and not just at a daycare center or a preschool. Indeed, most of the gains were from the improved education and pay levels of people who work inside a home. (Unfortunately, it still excludes nannies who are paid under the table or family members who are not being paid at all, and it’s unclear how that affects the findings.)
Here are the numbers:
The authors estimate that there are 2.2 million early childhood care and education workers in the United States. They studied a nationally representative subsample of them from the Current Population Survey (CPS), which is administered every month by the U.S. Census and the Bureau of Labor Statistics. About 56 percent of them work at a day-care center, 26 percent of them work in a home and 18 percent work at a school.
Average annual earnings increased by 51 percent, from $10,746 to $16,215 between 1990 and 2009. Some of this increase was because these childcare professionals were working more hours, but average wages increased 33 percent from $8.80 per hour in 1990 to $11.70 per hour in 2009. Workers with employer‐paid pension and/or health benefits increased from 19 percent to 28 percent during the same period. Annual turnover decreased substantially from 32.9 percent in 1990 to 23.6 percent in 2010. In 2010, 28 percent of these childcare workers had at least a Bachelor’s degree, compared with 21 percent in 1990.
Still, the low-education, low-wage, high-turnover stereotype remains true. Nearly 40 percent of these workers only have a high school degree and $11.70 an hour keeps these workers below the poverty line. The turnover rate means that one quarter of childcare workers in 2009 had left the field in 2010.
Low and incomplete marks for most prestigious teacher training programs
I was just starting to poke through the National Council on Teacher Quality’s first Teacher Prep Review, published June 2013, which makes a data-rich argument that the nation’s teacher training programs are admitting some of the weakest students in the nation and spewing out unprepared teachers at the end. I was struck by how few of the nation’s most prestigious and famous teacher training programs were in it. For example, neither Harvard University’s Graduate School of Education nor Columbia Teachers College were among the 1200 programs rated. The report explains that’s because private institutions, unlike public universities, don’t have to comply with open records requests. When you dig deep into the report, these private institutions are rated on some criteria where there is information. Strikingly, both Harvard and Columbia get a paltry two out of four stars for selectivity, that is, whether the school admits the best and the brightest. Why? The report explains that neither Harvard nor Columbia “require a grade point average of 3.0 or higher overall or in the last two years of undergraduate coursework that provides assurance that candidates have the requisite academic talent.” Really, Harvard’s admissions office is not selective enough for NCTQ?
New data on Australians who go into teaching
The Australian teaching system has long been revered in the United States. Even today Aussie is the biggest professional development consultancy in New York City. Back in Australia, the government is trying to use data to track the teaching profession more closely. A first annual data report on the teaching profession was recently released in May 2013 that looks into what kind of people go into teaching. A brief summary of the new data report was printed in The Australian Teacher magazine. My initial takeaways are 1) Many low-income people go into teaching and 2) Principals say new education graduates aren’t good at recognizing differences among students. Curious if we have similar analyses of who goes into teaching in the United States and what U.S. principals think of newly minted teachers.

