U.S. private school students not much better than public school students in math
In the 2012 international test that measures what 15-year-old students know, called PISA, private school students did only a smidgen better than public school students on the math test. Almost seven percent of American 15-year-olds attend private school and they scored an average of 486, only four points more than the average public school student, and still below the international average of 494. Private school students did do a bit better in science at 508, surpassing the international average of 501.
Where private school students shine is in reading, outperforming their public school peers by 22 points. Private school students, if they formed a separate nation, would rank at #10 behind Ireland in this subject. However, if we broke out the private school students for each nation, their scores would be higher too and American private school kids would no longer be among the top 10 readers. Indeed, US private school students would be no better than average.
| 2012 PISA test scores of public school and private school students | |||||||
| Reading | Math | Science | |||||
| Country | Category | % | Mean | Mean | Mean | ||
| United States of America | public | 93.01 | 497 | 482 | 498 | ||
| United States of America | private | 6.99 | 519 | 486 | 508 | ||
| OECD Total | public | 82.37 | 490 | 481 | 492 | ||
| OECD Total | private | 17.54 | 519 | 514 | 520 | ||
| OECD Average | public | 80.69 | 491 | 489 | 496 | ||
| OECD Average | private | 19.2 | 527 | 522 | 528 | ||
| OECD Total = (OECD as single entity) – each country contributes in proportion to the number of 15-year-olds enrolled in its schools | |||||||
| OECD Average = (country average) – mean data for all OECD countries – each country contributes equally to the average | |||||||
| Data generated from http://pisa2012.acer.edu.au | |||||||
Related stories:
Top US students fare poorly in international PISA test scores, Shanghai tops the world, Finland slips
Conventional wisdom is that top U.S. students fare well compared to their peers across the globe. According to this line of reasoning, the US doesn’t make it on the list of the top 25 countries in math (or top 15 in reading) because America has higher poverty and racial diversity than other countries do, which drags down the national average.
Wrong.
The latest 2012 PISA test results, released Dec. 3, 2013, show that the U.S. lags among 65 countries (or sub country entities) even after adjusting for poverty. Top U.S. students are falling behind even average students in Asia. I emphasize Asia because Asian countries (or sub entities) now dominate the top 10 in all subjects: math, reading and science.
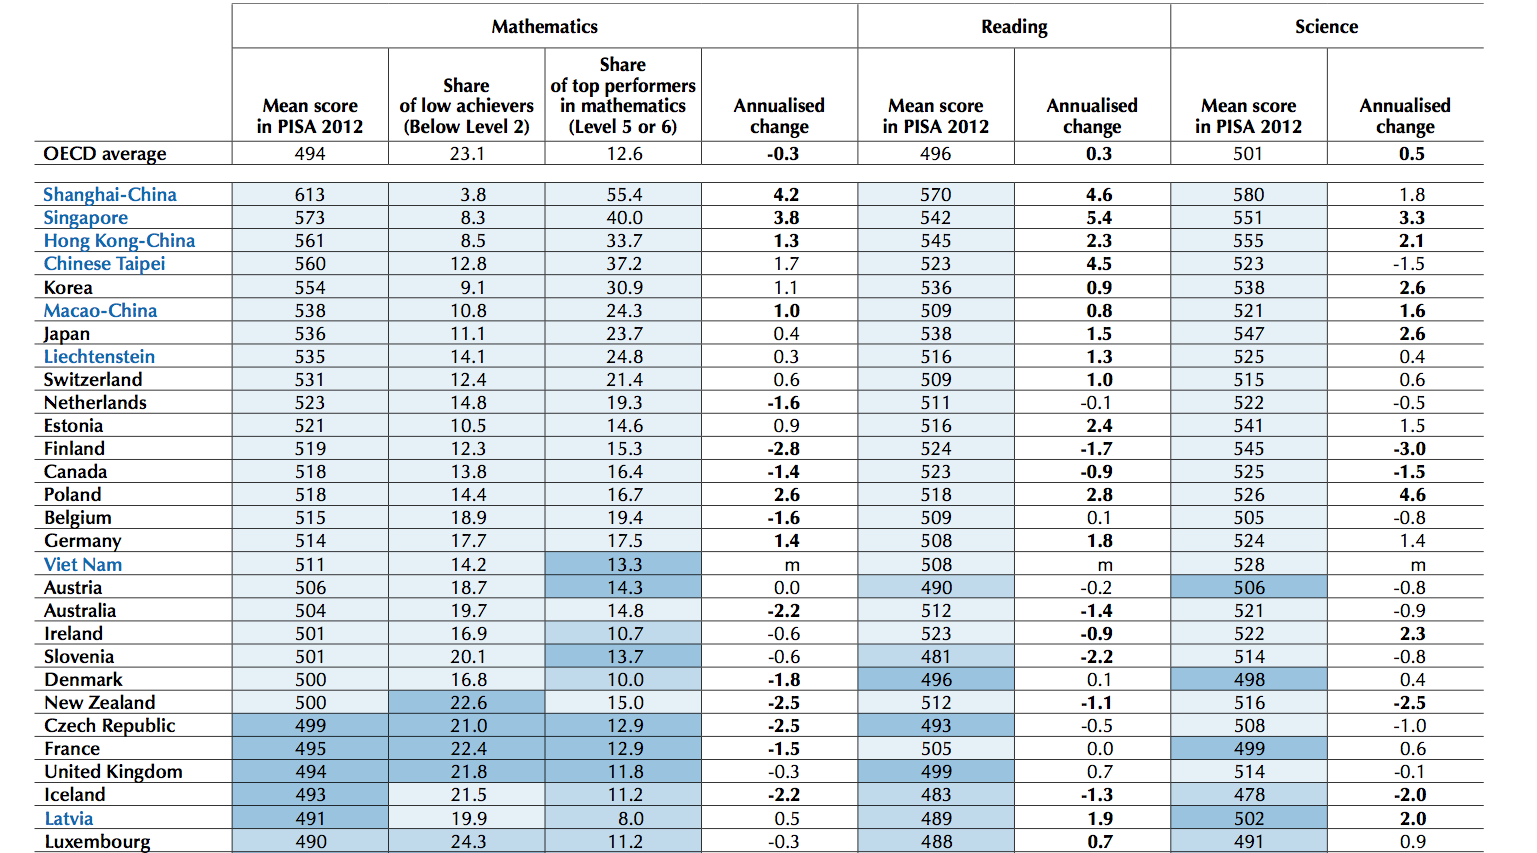
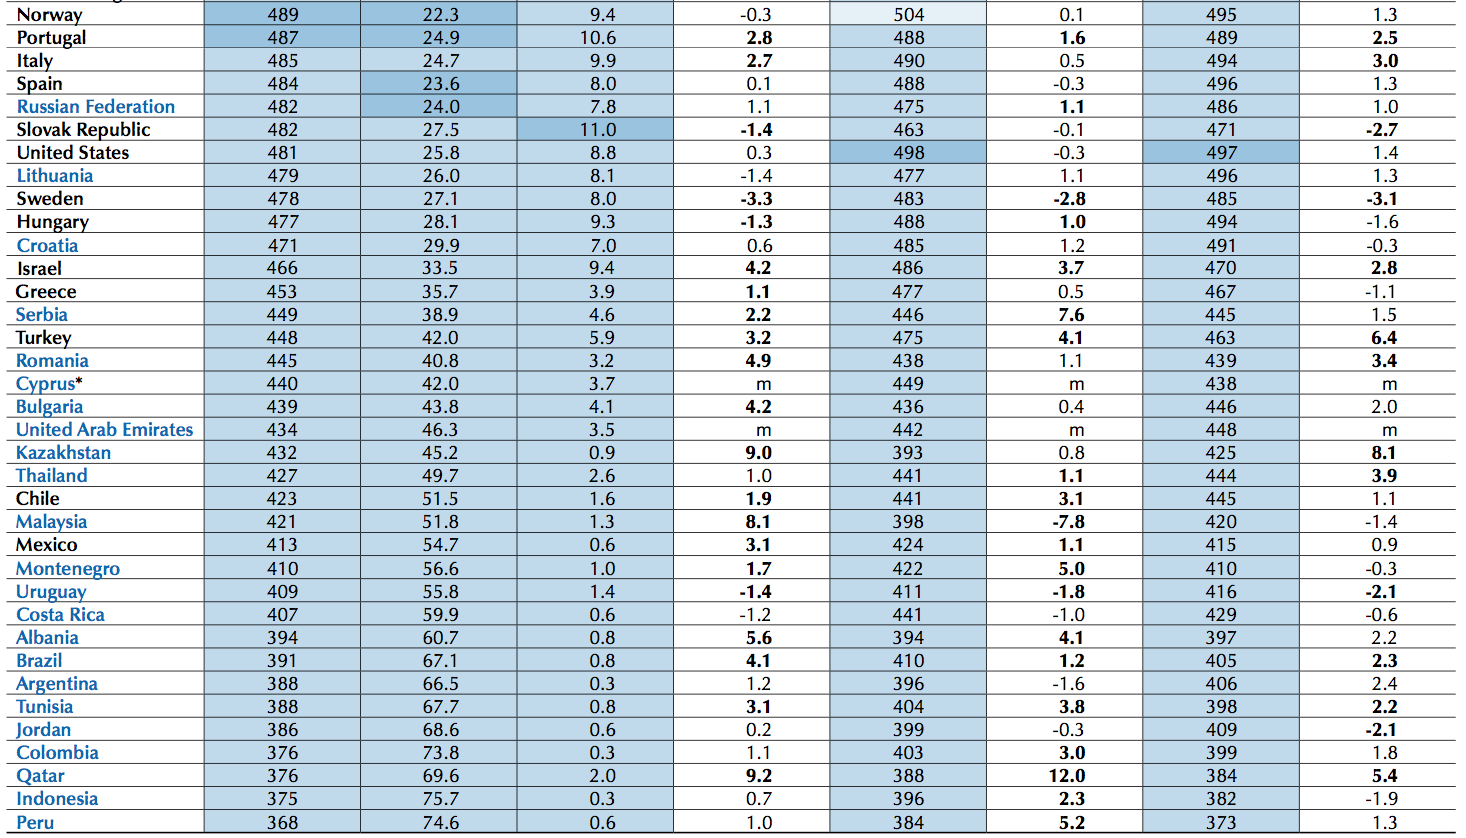
In descending order from the top spot in math, they are (1) Shanghai, (2) Singapore, (3) Hong Kong, (4) Taipei, (5) Korea, (6) Macao, (7) Japan, (8) Lichtenstein, (9) Switzerland and (10) the Netherlands. Most of these countries are also posting top-of-the charts reading scores. (Here’s the global list. See Table 1.A on page 19. I also chain the list — in two parts — at the bottom of the post for those who are having trouble clicking on the pdf file. Click on it to see a larger full-screen version.)
Let’s break down the data for the 2012 PISA (Program for International Student Assessment) conducted by the Organization for Economic Cooperation and Development (OECD) taken by 15 year olds around the world.
* The United States has a below average share of top performers in mathematics. Only 2% of students in the United States reached the highest level (Level 6) of performance in mathematics, compared with an OECD average of 3% and 31% of students in Shanghai, the top performing entity in this year’s PISA test.
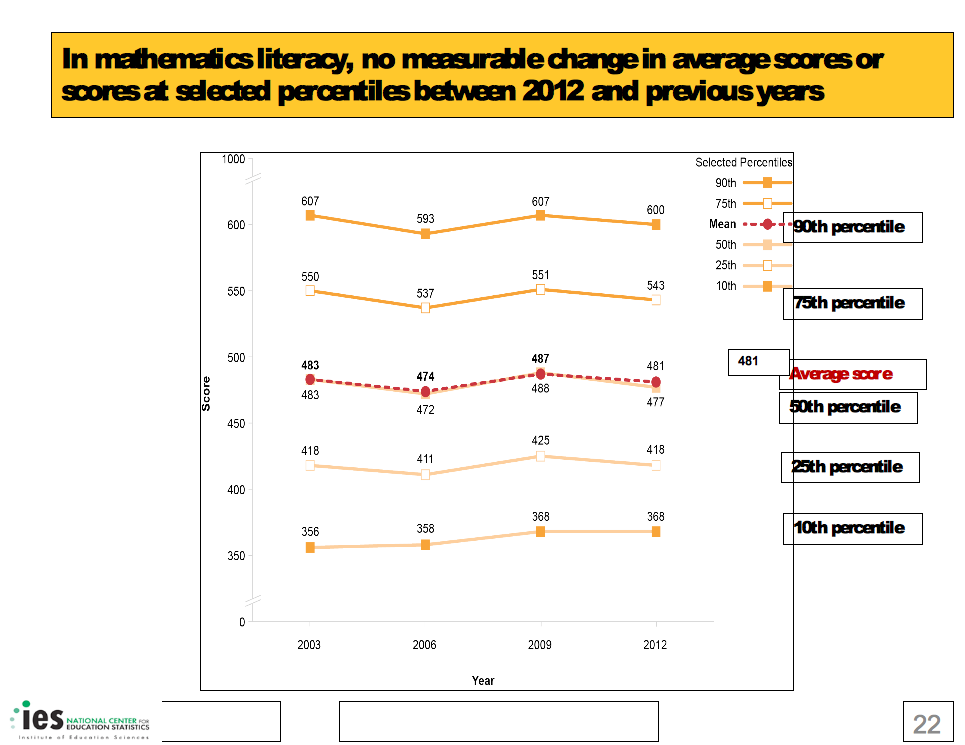
* Students at the 90th percentile in the United States — the very top — are below the average student in Shanghai. Top U.S. students scored 600 in math. The average score in Shanghai was 613. (Click on chart at the top right of the page to see this in more detail).
* Massachusetts, the top performing state in the nation, did not come close to the top 10 in math. Their 15 year olds scored a 514 in mathematics, placing the state even with Germany at number 16. (To put this in context, Germany is alarmed by how low its PISA scores are.) Massachusetts did prove better in reading. Only three education systems scored higher.
* Poverty rates alone do not explain low U.S. test scores. In a telephone briefing, Andres Schleicher explained that the OECD attempted to adjust test scores for income and put all the students of the world on a level playing field. It turns out that the US has slightly lower poverty and diversity than other OECD countries on average. The average U.S. test score dropped after making this adjustment.
* There is also a problem at the bottom end in the United States. The scores of low-income Americans are exceedingly low. The U.S. has a higher percentage of kids that can’t even hit the lowest levels on the math tests than other OECD countries do on average. So, it is true that the scores of poor U.S. students are dragging the average down. Still, absent poor students, U.S. scores would still be low.
Interesting tidbits:
* Finnish slide. Seven years ago, U.S. educators and policy makers were all traveling to Finland, trying to understand the secrets behind its high achievement. Finland declined between 2006-2009 and again between 2009-2012, scoring 548 in math in 2006 and 519 in 2012. Finland is firmly out of the top 10 in math and science, although its reading scores are still high. The OECD’s Andres Schleicher says that demographic changes and immigration have not been high enough to explain the test score slide and it’s a bit of a mystery.
* Poland is showing substantial increases in test scores on all three tests, rising well above the United States.
* Vietnam’s debut on the list is very impressive. This high poverty nation falls between Austria and Germany at #17.
* Stagnation. U.S. scores on PISA exams haven’t improved over the past decade. See here. That’s a bit of a contrast from the NAEP exam where American students have been showing modest improvement. I believe the NAEP exam plays to U.S. strengths of simple equation solving. It has fewer word problems where students have to apply their knowledge to a new circumstance and write their own equations and models.
* Shanghai was also the top performer in 2009. Other provinces in China are expected to start reporting PISA results beginning with the next 2015 test and have similarly high scores.
* Asia rising. Notice the strong gains among the top performing countries. Shanghai, Singapore, and the next four education systems are all posting strong annual gains on their PISA tests. It may be that top US students aren’t getting weaker, but stagnating, while the rest of the world, especially Asia, is getting stronger.
* $$$$: The OECD data show almost no link between spending on education and PISA test results. Wealthier nations tend to score better. But the amount of money that a nation spends on education doesn’t seem to matter much. The United States is one of the biggest spenders in education, spending $115,000 per student on average between the ages of 6 and 15. The Slovak Republic spends less than half that amount at achieves similar test scores. Only four countries spend more than the United States: Austria, Norway, Luxembourg and Switzerland.
* Test quality. I took sample questions from the 2012 PISA math test and was impressed with the sample questions. Many are not multiple choice. So you can’t always use a Princeton Review technique of eliminating answer choices. You have to calculate answers yourself. I was also surprised by how many word problems there were in which you had to come up with models and equations yourself and not just solve for x in a given equation.
* Cheating. In previous posts and among colleagues, questions are coming up about cheating, especially in China. I haven’t seen evidence of widespread cheating on PISA tests that would affect a nation’s score. I know that an outside Australian contractor is involved in administering the PISA tests in China. But please comment if you have any information on PISA cheating.
Take away:
Yes, the United States has an achievement gap. Poor students are doing poorly. But our top students are nothing to brag about.
Related Stories:
Shanghai likely to repeat strong results on international PISA test in December (Nov. 18, 2013)
Data Debate: Smartest U.S. states don’t hold a candle to global competitors (Oct. 30, 2013)
Unclear where U.S. students stand in math and science (Oct. 25, 2013)
Men more likely than women to quit science or math in college
A new statistical analysis by the National Center for Education Statistics sheds some light on why so few Americans pursue STEM subjects (Science, Technology, Engineering and Math) in college. “Some 28 percent of beginning bachelor’s degree students and 20 percent of beginning associate’s degree students entered a STEM field at some point during their enrollment between 2003 and 2009. As of 2009, 48 percent of the bachelor’s degree STEM entrants and 69 percent of the associate’s degree STEM entrants had left these fields by either changing majors or leaving college altogether without completing a degree or certificate.”
What really surprised me was that women have more staying power in STEM subjects than men do.
“Bachelor’s degree STEM entrants who were male or who came from low-income backgrounds had a higher probability of leaving STEM by dropping out of college than their peers who were female or came from high-income backgrounds, net of other factors.”
More than 80 percent of U.S. states are producing high school feedback reports
The Data Quality Campaign issued its annual survey, Data for Action 2013, of how states are collecting and using education data on Nov. 19, 2013. The advocacy group argues that using data more would improve education policy and classroom instruction. It reported that two states, Arkansas and Delaware, were using data the most. But they’re also seeing a widespread growth of data collection and crunching around the country.
High school feedback reports are a good example. These reports show how graduates from a particular high school fare when they go on to college. The bar chart I created (using data that DQC helped me pluck from several years of surveys) shows that more than 80 percent of U.S. states are now producing a publicly available high school feedback report. Not all of them are useful, high quality ones. (Only seven states are producing great ones, according to DQC). The group argues these reports are important because they help parents dig deeper than graduation rates, and learn whether graduates of a particular high school were able to handle college math right away or whether they had to take remedial classes first.
Another measure of how data use is becoming institutionalized in education is that the data systems themselves are becoming part of state budgets. Back in 2009, only nine states were funding their own student data systems that can track students from kindergarten through college. Now, 41 states are funding them.
The group also reported that 35 states now give teachers access to student data through some sort of computer dashboard. But it’s still hard for teachers to use this data to target academic weaknesses and help change their instruction on a daily basis.
Paige Kowalski, director of state policy and advocacy at the Data Quality Campaign, said that “these systems are pretty new” (built within the last six years). Thus far, she said, states have been focusing on easy-to-produce aggregate reports, such as the high school feedback reports. “When you’re talking about student-level data, it gets trickier. Privacy. Log-ons. And there’s so much data. No teacher wants to look at 500 data points on a screen. There’s a lot more to figure out,” Kowalski explained.
Related story:
Data Quality Campaign’s Aimee Rogstad Guidera discusses anti-data backlash and more
Low income students show smaller gains within Washington DC’s NAEP test score surge
I remain obsessed with trying to understand the gigantic seven point surge in scores that Washington DC posted on the 2013 NAEP national assessment, which I first reported on Nov. 7, 2013. Last week, on Nov. 15th, I broke the test data down by race and noticed that while black scores did improve, the seven point increase was more influenced by the growing population of white and Hispanics. Both groups, on average, have even higher test scores than blacks do. A blog reader asked me if I looked at socioeconomic status. Unfortunately, NAEP doesn’t have a SES variable, but it does look at which students are low income as measure by whether they qualify for free or reduced price lunch.
Average Fourth Grade Mathematics Scores in Washington DC on the 2013 NAEP
|
Qualifies for free or reduced price lunch |
Doesn’t qualify for free or reduced price lunch |
|
|
2013 |
220 |
261 |
|
2011 |
213 |
246 |
|
change |
up 7 |
up 15 |
So it’s interesting to see that the lowest income students are not driving the gains as much as the middle class and upper income students are. That jives with what NCES Commissioner Jack Buckley noted nationwide, that the bottom students are not making the same incremental progress that the top students are.
I also broke down the DC results by percentile, but didn’t see the same stark trend. Not sure what to make of this…
Average Fourth Grade Mathematics Scores in Washington DC on the 2013 NAEP by Percentile
|
10th |
25th |
50th |
75th |
90th |
|
|
2013 |
184 |
205 |
229 |
252 |
273 |
|
2011 |
176 |
199 |
222 |
245 |
267 |
|
change |
up 8 |
up 6 |
up 7 |
up 7 |
up 6 |
Related Stories:
Is gentrification in Washington DC driving the surge in test scores?
Shanghai likely to repeat strong results on international PISA test in December
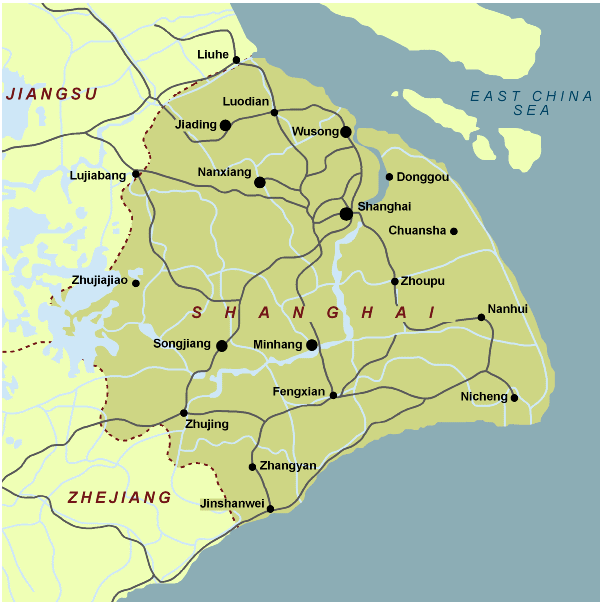 Back in 2010, experts were stunned when 15-year olds in Shanghai, China earned the top scores in reading, math and science on the 2009 PISA exams, also known as Program for International Student Assessment. And when the 2012 results come out on Dec. 3, it seems that Shanghai may be poised to do it again, according to researchers who are familiar with the preliminary results.
Education testing experts cautioned against comparing Shanghai to an entire nation, such as Japan or the United States. The megapolis of 23 million is one of the wealthiest, most cosmopolitan cities in China. Still, low income residents are part of the sample of students who are tested*. And this year, we will be able to compare Shanghai with comparable sub-regions of other countries. (My prediction: Massachusetts does miserably compared to Shanghai).
Researchers say they are also seeing high test scores in other Chinese provinces where PISA trials are taking place, but official scores from regions outside of Shanghai won’t officially be reported until 2015. “You will be surprised at how strong some of the results are in the provinces,” said Andreas Schleicher of the Organization for Economic Cooperation and Development, which administers the PISA tests.
Shanghai’s replication of results, combined with strong test results in the provinces, make me want to ask this question: Does China have the best educational system in the world?
Some might dismiss the test results and say that Chinese students are good testers, but don’t necessarily have the higher order thinking skills and creativity that other education systems try to cultivate. Its national curriculum is built around exam preparation. On the other hand, China is clearly doing something right and it’s worth understanding the nuts and bolts of their system. In this write up about the Chinese educational system by the International Center for Educational Benchmarking, two things popped out at me: 1) large class sizes (50 students/class); 2) specialized teachers, who might only teach one particular class, such as “Senior Secondary 2 Physics”, but they teach it multiple times a day.
Schleicher adds that China differs from other top performing countries in that its teacher workforce isn’t drawn from the top students in Chinese society, as the teaching ranks are drawn from the top third in Japan, Finland or Singapore#. Rather, in China, the average teacher was himself an average student in high school. Instead, China boosts the professionalism of the teaching profession through constant teacher training. About 30% of a teacher’s time every year is spent on professional development.
*The children of migrant workers, who number about 9 million in Shanghai, are believed to be largely excluded from the PISA results. Migrants who don’t have Shanghai residency are not entitled to education there. But Shanghai recently relaxed its residency policies this past summer. Future tests might include migrant children
#By contrast, teachers tend to come from the bottom third in the United States.
Is gentrification in Washington DC driving the surge in test scores?
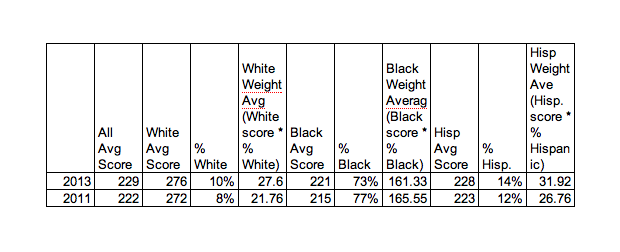
As I wrote on Nov. 7, 2103, Washington DC posted the one of the strongest test score gains in the nation on the 2013 National Assessment of Educational Progress and I wanted to look at how demographic shifts in the nation’s capital might be influencing these test results. I began by constructing this table.
Washington DC NAEP Test Results for Fourth Grade Mathematics
 Sources: Table A-12. Percentage distribution of fourth-grade public school students assessed in NAEP mathematics, by race/ethnicity, eligibility for free/reduced-price school lunch, and state/jurisdiction: 1992, 2003, and 2011
and
http://nationsreportcard.gov/reading_math_2013/#/state-gains
So my question is, what drove the 7 point increase in test scores? When you break the test scores down by ethnicity and weight them by their percentage of the student population, it’s interesting to see how both white and Hispanic test gains contributed more to the average score than black gains. True, black test scores increased by 6 points on average, but their share of the population is falling. Meanwhile, whites and Hispanics are growing populations in the city and their smaller test score gains are proportionally accounting for more.
I also found it interesting to see that the average White test score in the District is 276. That’s a very high number, surpassing the average white test score of Massachusetts by 16 points. I think that shows just how wealthy and highly educated the average white family is in Washington DC. But the whites of Northwest DC shouldn’t be too smug. Only 6 percent of the District’s students tested at or above the “advanced” threshold. In Massachusetts, 16 percent of the fourth graders are “advanced”.
As always, comments welcome.
Arizona, Wisconsin and Colorado have the highest concentrations of charter schools in the nation
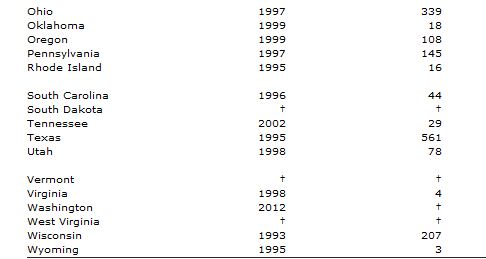
I was just looking at some updated “State Education Reform” statistics from the National Center of Education Statistics and was trying to make sense of the numbers of charter schools in each state. California has the most charter schools by far at 908, but it’s also the most populous state. So I decided to rank some of the states with high numbers of charter schools by the number of charter schools per capita. I was surprised to see that Louisiana doesn’t rise to the top, but Wisconsin does. Chained below are the original figures.
| State | Number of Charter Schools Operating 2010-11 | Population (US Census 2010) | Charter Schools Per Capita |
| Arizona | 519 | 6,392,017 | 8.1195E-05 |
| Wisconsin | 207 | 5,686,986 | 3.63989E-05 |
| Colorado | 168 | 5,029,196 | 3.34049E-05 |
| Minnesota | 176 | 5,303,925 | 3.3183E-05 |
| Michigan | 300 | 9,883,640 | 3.03532E-05 |
| Ohio | 339 | 11,536,504 | 2.9385E-05 |
| Oregon | 108 | 3,831,074 | 2.81905E-05 |
| California | 908 | 37,253,956 | 2.43733E-05 |
| Florida | 458 | 18,801,310 | 2.436E-05 |
| Texas | 561 | 25,145,561 | 2.23101E-05 |
| Louisiana | 76 | 4,533,372 | 1.67646E-05 |
| Pennsylvannia | 145 | 12,702,379 | 1.14152E-05 |
| North Carolina | 99 | 9,535,483 | 1.03823E-05 |
| New York | 170 | 19,378,102 | 8.77279E-06 |
Number of public charter schools operating, by state: 2010–11
Source: National Center for Education Statistics (NCES) Table 4.3 of State Education Reforms
Paying good teachers $20K to move to bad elementary schools works and is cheaper than reducing class sizes
A November 2013 Mathematica study conducted for the Institute of Education Sciences within the U.S. Department of Education shows that paying good teachers $20,000 to transfer to a low performing elementary school raised the test scores of students by 4 to 10 percentile points. No positive effect was found at the middle school level. Mathematica found that the same test score increases could be achieved by reducing class sizes and filling the teacher vacancies as usual. But it’s more cost effective to pay the bonuses. “The cost savings could be as large as $13,000 per grade at a given school,” according to the report. Furthermore, 60 percent of the 81 teachers in the study stayed at the low-performing schools even after the bonus payments ended.
Last month I wrote a piece about a highly reputable RAND study that concluded bonus pay for teachers doesn’t work. So the takeaway from these two studies is that you can’t pay teachers to teach better, but you can pay an already great teacher to move to a poor school.
A separate Mathematica study, also released in November 2013, documents just how substandard teaching quality is for low-income students. It found that disadvantaged students had access to less effective teaching in the 29 school districts studied and that effective teaching would close the achievement gap between rich and poor by 2 percentile points in math and in reading each.
Student participation in K-12 online education grows but fewer states run virtual schools and classes
It’s really hard to get a handle on the growth of online education. Schools are experimenting with all forms of it in a very decentralized way. One teacher might assign a Khan Academy video to a class one day for homework. Another school might contract with a for-profit online course provider, such as Apex, to provide electives that it can’t offer. No one is counting all this.
At the The International Association for K-12 Online Learning (iNacol) conference at the end of October 2013, the Evergreen Education Group put out its 10th report, Keeping Pace, attempting to track online education among kindergarten through high school students in the United States.
Evergreen found it impossible to compile data on so-called “blended learning,” where students learn some of the time from a teacher in traditional classroom and some of the time from a computer.
But over the past four to five years, Evergreen has been keeping consistent statistics on the number of U.S. states that run their own online schools and student participation in them. It’s hard to know how much this state-sponsored online education represents. “We know there’s a lot of activity out there not being reported,” said Amy Murin, the lead researcher at Evergreen who wrote the report. In particular, many large school districts have launched their own online courses.
But the data we do have show a steady growth in K-12 students enrolling in full-time online schools or taking individual classes online. At the same time, some states are getting out of the business of creating and running online schools and courses.
I created a couple time-series charts using data that Murin helped me pluck from the past five years. This first chart below shows that U.S. students in traditional k-12 schools enrolled in almost 750,000 online courses through their state during the 2012-13 school year. That’s more than double the 320,000 online enrollments four years ago in the 2008-09 school year. These are individual classes, generally not offered by the student’s school, such as Mandarin Chinese or AP Physics. At the same time, states are getting out of the business of running these courses. A peak of 31 states offered online supplemental courses for public school students in 2009-10. Currently, in the 2013-14 school year, only 25 states are offering them. But it’s quite possible that district and private programs are replacing these decommissioned state-run classes. Louisiana, one of the states that dropped out, is redirecting funds to external providers. By contrast, Connecticut closed its down because not enough students had enrolled.
Source: Evergreen Education Group
This second chart shows a slower, but similar trend for full-time online students. Students who are not in traditional schools, but receiving all of their education online has grown about 50 percent, from 200,000 students in 2009 to 310,000 students last year. And the number of states offering full-time virtual schools has dropped from a peak of 31 in 2011 to 29 in the current school year. This doesn’t necessarily mean that states are abandoning online education.
Source: Evergreen Education Group

