


Data Source: NCES
Conventional wisdom in education circles is that school segregation is worse today than before the Supreme Court ruled in 1954 that separate schools for whites and blacks were unconstitutional. Many in media are citing statistics from a May 2014 report from the Civil Rights Project at UCLA. Slate’s Jamelle Bouie wrote that it shows, “minority students across the country are more likely to attend majority-minority schools than they were a generation ago.”
But federal data from the National Center of Education Statistics (NCES) don’t entirely support this narrative that segregation is getting worse.
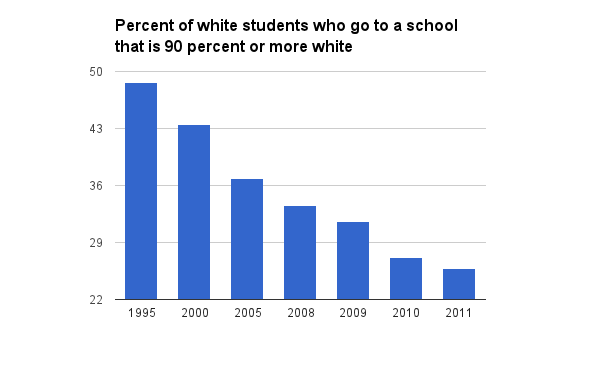
Specifically, this table shows that about 49 percent of white students attended a school that was 90 percent or more white back in 1995, the oldest data in these tables. In the most recent data for 2011, only 26 percent of white students attended a school that was 90 percent or more white. That’s a huge drop. Whites are much more likely to be going to schools with some level of integration.
Black students were also less likely to go to an all black school in 2011 than they were in 1995. In 1995, 22 percent of blacks attended a school that was 90 percent or more black. In 2011, 17 percent attended a school that was 90 percent or more black. That’s a 4 percentage point drop in blacks who go to schools that are all or almost all black.
For Hispanics, whose population is soaring, it’s a different story. About 15 percent of Hispanic children attended a school that was 90 percent or more Hispanic in 1995. That grew to 17 percent of Hispanic students in 2011. But the peak was actually in 2008 and this kind of intense segregation of Hispanic students seems to be stabilizing.
Others have noticed the increased prevalence of schools dominated by low-income blacks and Hispanics. Perhaps blacks are not more likely to go to a black-only school, but a school that has only blacks and Hispanics? The NCES data doesn’t tabulate which schools are more than 90 black and Hispanic, but it does tabulate which schools are more than 90 minority. However, this minority data counts all minorities, including Asian students.
This table shows that 34 percent of blacks attended a school that was 90 percent or more minority in 1995. That rose a lot by 2011. More than 39 percent go black children attended a school that was 90 percent or more minority. There was a similar jump for Hispanic students. About 35 percent attended a school that was 90 percent or more minority in 1995. More than 41 percent of Hispanics were attending this kind of school in 2011.
Interestingly, the numbers are also going up for whites and Asians. Even white students are more likely to be attending a school that is 90 percent or more minority today than they were in 1995. Everyone is more likely to be in a school with more minorities.
Whites are no longer in the majority in the U.S. school system (see this post). If we lived in an ideal society with perfect integration, all of our schools would indeed be majority minority going forward. And so declaring that minorities are more likely to be going to a school that has 50 percent or more minorities doesn’t indicate increased segregation.
It’s obviously not a good sign when the percentage is rising of Hispanics and blacks who are going to schools that are 90 percent or more minority. What other kinds of data thresholds should we use to demonstrate segregation?
NCES Data sources:
Percentage of each racial/ethnic group by the percentage of their own racial/ethnic group in the school. http://nces.ed.gov/programs/
Percentage of each racial/ethnic group by the percent of minorities in that school. http://nces.ed.gov/programs/
Related stories:
White students predicted to be in the minority in U.S. public schools by fall 2014
