


AndreSource: Andreas Schleicher OECD
Do educators’ perceptions of how disadvantaged their students are matter? Put another way, when teachers think their students are underprivileged, do they have lower expectations for them, and do their students achieve less at school?
In a July 22, 2014, article “Poverty and the perception of poverty – how both matter for schooling outcomes,” Andreas Schleicher, director of education and skills at the Organization for Economic Cooperation and Development (OECD), argues that perceptions often matter more than reality, with distressing consequences. He found that principals in some countries vastly overestimate the poverty level of their students, and their perception of disadvantage negatively correlates with student math achievement. That is, the greater the misperception of poverty, the more likely it is for 15-year-old students’ math scores to be predicted by their actual socio-economic status, and the harder it is for disadvantaged students at the bottom of the socio-economic ladder to score among the top students.
“In countries like France and the United States, perceived disadvantage is far greater than real disadvantage, and it makes a significant difference for student performance,” Schleicher wrote in the article.
Conversely, he found that educators in many top-performing nations greatly underestimate how disadvantaged their students are. Yet the truly disadvantaged students in these nations are more likely to score in the top tier on the PISA math test.
Schleicher’s data analysis mashed together three different data sets: international math test results, teacher surveys and socio-economic indicators. (Footnote: The math test was the OECD’s Program for International Assessment (PISA) given to 15-year-olds around the world. The survey data was from the OECD’s Teaching and Learning International Survey (TALIS) question 15c. Socio-economic indicators came from the OECD’s own index of economic, social and cultural status (ESCS) that is generated with the PISA test results.)
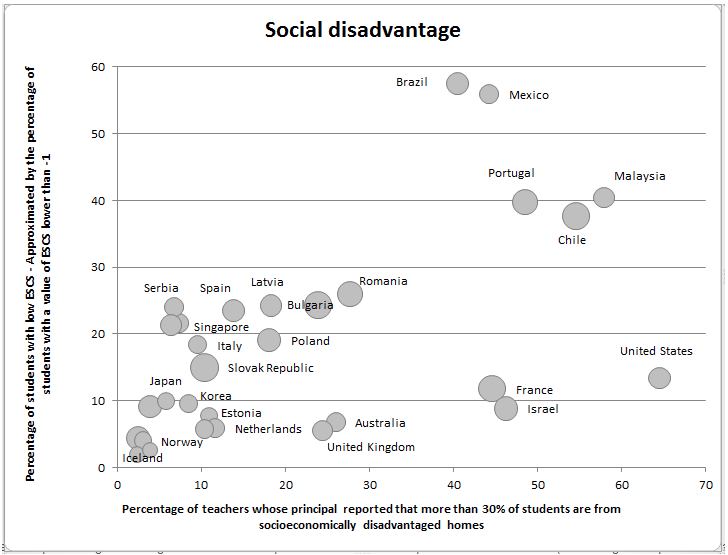
In the United States, for example, 65 percent of teachers work in middle schools where the principals surveyed said that more than 30 percent of their students come from socieconomically disadvantaged homes, the highest perception-of-poverty rate among the 30 countries analyzed by Schleicher. In reality, only 13 percent of American 15-year-olds come from disadvantaged homes, by OECD calculations. (Footnote: The OECD socio-economic index factors in not only income, but also parental education, educational resources at home and other family possessions. Because the United States is a relatively rich country, many among the 21 percent of school-age children living below the national poverty line are not counted in the low-income bracket by OECD standards, hence the OECD’s seemingly low figure of 13 percent.)
At the same time, Schleicher calculates that only 20 percent of disadvantaged students in the United States are able to score in the top quartile on the PISA math test. In France, it’s about the same. In Israel, another country for which there is a large gulf between perception and reality, only 10 percent of disadvantaged students score among the top in math.
By contrast, the percentage of actually disadvantaged children in Japan and Korea (about 10 percent) is similar to the percentage in the United States — but only 6 percent of Japanese principals and 9 percent of Korean principals report believing that 30 percent of their students are disadvantaged. Six times as many U.S. principals believe the poverty rate is that high. In Croatia, Serbia and Singapore, more than 20 percent of students are actually disadvantaged — much higher than in the United States — yet not more than 7 percent of principals say they have significant populations of disadvantaged students.
(Andreas Schleicher’s bubble chart, reproduced at the top of this story, depicts perception on the horizontal axis and actual disadvantage on the vertical axis. The larger the circle, the more educational inequality there is in that country, i.e., the more a student’s socio-economic status determines his math achievement. Click on the chart to see a larger version).

This article also appeared here.
In Singapore more than half the students from the bottom quarter of the socio-economic spectrum score in the top quarter of the world’s students on PISA. In Japan, 45 percent of disadvantaged students perform better on the PISA test than their backgrounds would predict. That’s remarkable educational mobility: roughly half of the most disadvantaged students in the bottom 25 percent in these countries score in at the top 25 percent.
This is fascinating. I asked Scheicher how much this analysis hinges upon where you set the poverty level. If the OECD were to set the bar higher, closer to where the U.S. sets its own poverty line, there would not be such a giant gulf between perception and reality. And we could not blame US educators for overestimating poverty so enormously.
Schleicher admits that poverty is a relative measure, which each country defines differently. If the OECD used a higher bar, every nation’s poverty rate would simply be much higher. But American educators would still have the highest perceptions of student poverty. His conclusions about educational opportunity — or lack thereof — for the bottom quartile would still be true.
“Obviously, a child considered poor in the United States may be regarded as relatively wealthy in another country,” he wrote, “but the fact that the perceived problem of socio-economic disadvantage among students is so much greater in the United States – and in France too – than the actual backgrounds of students also suggests that what school principals in some countries consider to be social disadvantage would not be considered such in others.”
The main concern I have about the correlation between perceived poverty and educational opportunity is that U. S. students post mediocre performances on the PISA math test in general. Yes, low-income students don’t do well on PISA test, but most wealthy students don’t, either. And I suspect that U.S. teachers don’t harbor lower expectations for rich Americans!
Related stories:
What makes for happier teachers, according to international survey
PISA math score debate among education experts centers on poverty and teaching
Top US students lag far behind top students around the world in 2012 PISA test results
The number of high-poverty schools increases by about 60 percent
