


Source: NCES TUDA Power Point of Jack Buckley
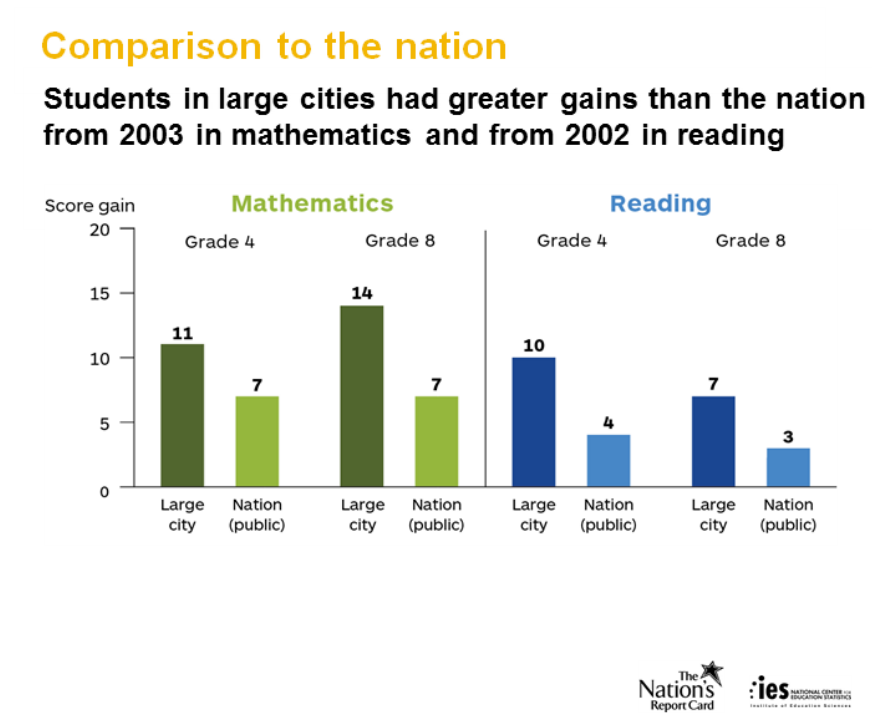
The test scores of fourth and eighth graders in large cities have been improving faster than the national average has over the past decade, according to federal test data released Dec. 18, 2013. Wide achievement gaps between large cities, often with huge concentrations of low-income minorities, and the average U.S. student have closed by as much as 43 percent.
“If you look solely at any two-year testing cycle, the results are sometimes less conclusive and they sometimes lead observers to conclude that urban schools are not making any progress. But if you stand back from the individual trees, you will see a forest that is growing taller and getting stronger,” said Michael Casserly, executive director of the Council of the Great City Schools, which works with the National Center of Education Statistics (a division of the US Department of Education) to collect samples of urban test scores on the National Assessment of Educational Progress, the main test that is taken throughout the country every year among fourth and eighth graders.
“In general, we are encouraged by the new results, but we are not satisfied with them. We know we need to accelerate. And we know that our gaps are still too wide,” Casserly added.
This year marks the first time that 10 years of urban test data is available in math and reading, enabling researchers to make conclusions about long-term trends. Cities above 250,000 people and with large concentrations of minorities and low-income students are invited to participate in this Trial Urban District Assessment (TUDA). In 2013, 21 of 36 urban districts that met these thresholds did. But 10 year trend data for math and reading is available only for the 10 districts that began participating back in 2002 and 2003. Test data covers public school students and excludes private schools. Charter schools are also largely excluded, especially those chartered by a state, but some cities maintain oversight of charter schools and may have included them. You can find all the data here.
Washington DC, which lags the nation in both math and reading, showed huge gains among fourth and eighth graders in both subjects since 2003 and 2011. It was the only city in the nation to show gains on all four tests since 2011. In fourth grade math, for example, Washington DC improved by 24 points since 2003, more than three times the national gain of 7 points during the same time period.
It is unclear what is behind the outsized gains in Washington DC. Gentrification and policy changes have happened simultaneously. Both white and Hispanic populations have grown considerably while the black population has fallen. For example, 3 percent of 4th graders were white back in 2003. In 2013, 13 percent were white. And within the declining black population, many higher income blacks have departed the district, leaving the black population within the District slightly poorer on average.
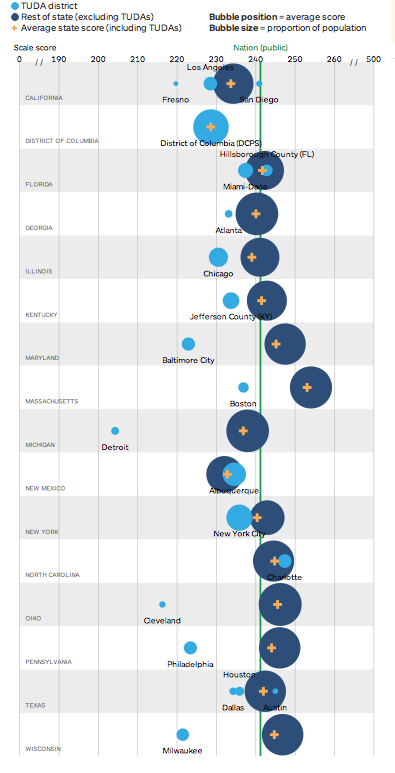
Still, urban districts, including Washington D.C., continue to lag behind the nation and the average of their home states. This bubble chart depicting fourth grade math scores shows how far behind most of these 21 cities are. Each blue dot represents a city. And you can see how the blue dots trail the big navy dots (their home states) and the green line (the nation). The exceptions are Charlotte, Austin, Hillsborough County (FL) and San Diego, all of whose poverty rates are lower than typical big cities. On the other end of the spectrum, nearly 100 percent of the students in the Cleveland public schools qualify for free and reduced price lunches, the measure of poverty used in this data collection. Click on the chart itself to see it pop up in a larger size. You can generate your own version of this chart on the NCES website.
A list of the 21 cities that participate in the Trial Urban District Assessments.
1. Albuquerque Public Schools
2. Dallas Independent School District
3. Hillsborough County (Tampa, Fla.)
4. Atlanta Public Schools
5. Austin Independent School District
6. Baltimore City Public Schools
7. Boston Public Schools
8. Charlotte-Mecklenburg Schools
9. Chicago Public Schools
10. Cleveland Metropolitan School District
11. Detroit Public Schools
12. District of Columbia Public Schools
13. Fresno United School District
14. Houston Independent School District
15. Jefferson County Public Schools (Louisville, Ky.)
16. Los Angeles Unified School District
17. Miami-Dade County Public Schools
18. Milwaukee Public Schools
19. New York City Department of Education
20. San Diego Unified School District
21. School District of Philadelphia
