The National Assessment of Educational Progress, run by the U.S. Department of Education, is the only test that is administered in schools across every state in the nation. Fourth and eighth graders across the country have shown meaningful progress on it since the early 1990s, especially in math. The 2013 results in these younger grades even showed small improvements from 2011. (Source: NAEP Mathematics and Reading 2013).
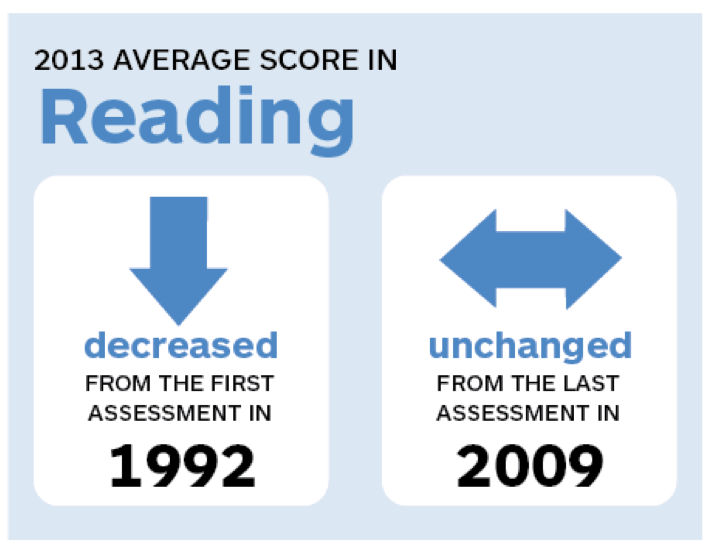
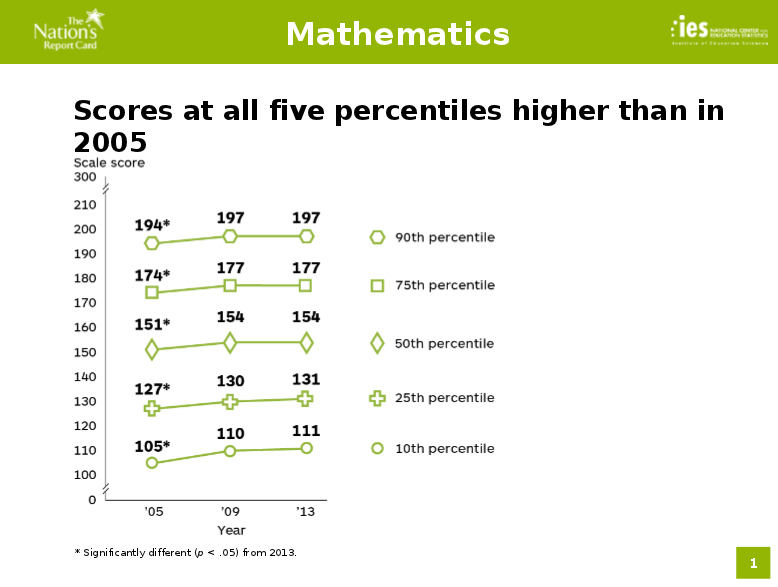
But the 2013 testing results for twelfth graders, released May 7, 2014, are woefully stagnant. The scores for high school seniors haven’t improved at all since 1992, when reading tests were first administered. Indeed, today’s reading scores are actually lower than they were in 1992. The math results, which date back to only 2005, show a modest increase right after that first year. But it’s been complete stagnation since.
It’s hard to make sense of this data. How do you explain why there are improvements in fourth and eighth grade, but not twelfth?

This article also appeared here.
One explanation could be demographic changes. Today there are many more minorities in twelfth grade. The Hispanic population, which has typically scored lower, has exploded. Hispanics have tripled from 7% of high school seniors in 1992 to 20% in 2013. The white population, which has traditionally scored higher, has declined from 74% to 58% in the same time period. More students are diagnosed with a disability today (11% in 2013 vs. 5% in 1992). More students are English language learners.
Furthermore, the high school graduation rate has jumped from 74 percent to 81 percent. That means that the weakest students who used to drop out of high school and, were previously not around in twelfth grade to be tested on the NAEP, are now taking the test.
“Our twelfth grade population is our population. And we don’t explain away test scores based on demographics. But it’s useful to keep in mind that we are seeing increases in subgroups that have traditionally performed lower,” said John Easton, acting commissioner of the National Center for Education Statistics and director of the Institute of Education Sciences.
The pool of high school students being tested in 2013 is clearly a weaker pool than the one tested in 1992. That might be masking improvements that we otherwise would have seen had demographic changes not occurred.
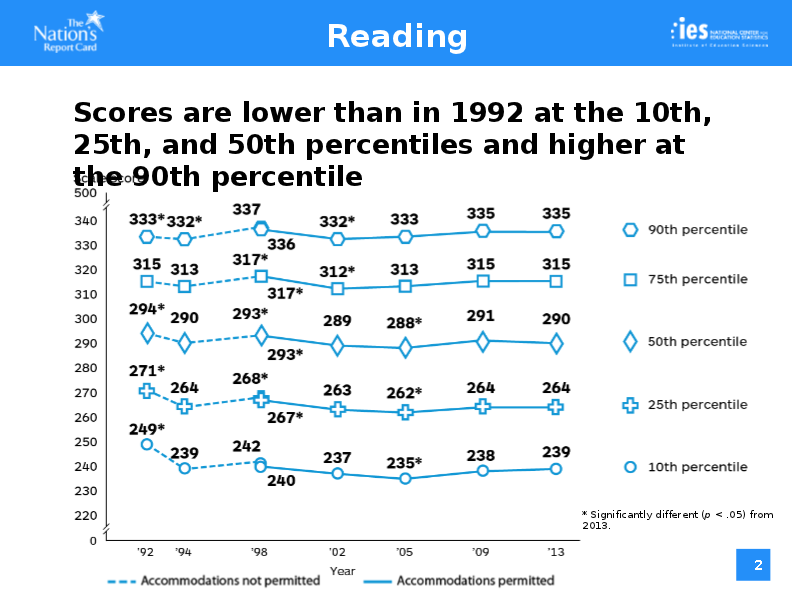
But here’s the thing. When you look at top achieving students in the top 75th and 90th percentiles, their scores are FLAT. (See the NCES charts below). High achieving students aren’t improving at all. So you can’t blame the infusion of more low performing students in the testing pool for the disappointing test scores. Even if we hadn’t introduced a greater number of weaker students into the mix, the scores of our high school students would still be stagnant.
Indeed, when you drill down by percentile, it’s the weakest students who are showing modest improvements. If not for their improvements, the national average would have declined!
Related stories:


