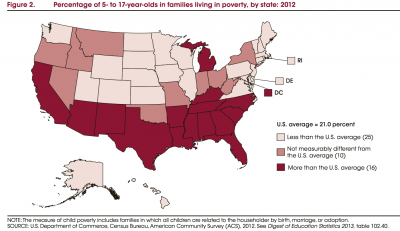
One in five school-age children lived in poverty in 2012, compared to about one in seven children back in 2000. That’s a 40 percent jump in child poverty in the last dozen years. A household of four people with less than $23,283 in income in 2012 was defined by the Census Department as poor.
This data comes from the latest annual report, “The Condition of Education 2014,” published by the National Center for Education Statistics on May 29, 2014.
The child poverty rate had been declining in the 1990s, but has taken a turn for the worse since 2000.
There is a striking north-south divide when it comes to child poverty. Southern states tend to have more than 21 percent of their school age children living in poverty. Northern states tend to have fewer. Michigan is the only northern state to have this kind of severe child poverty. (Washington DC’s child poverty rate exceeds 21 percent as well). Click on the map for a larger image.
When you break the data down by race and family structure, there are other striking patterns. Almost 40 percent of all black children under 18 are living in poverty, compared with 33 percent of Hispanic children. Whites and Asians have a similar child poverty rate of 13 percent and 14 percent, respectively. But the high poverty rate is clearly intertwined with family structure. Only 15 percent of black children who live in a married-couple household live in poverty, compared with 53 of black children in a mother-only household. But poverty is stubbornly high even in married Hispanic households; 22 percent of Hispanic children who live in married-couple households are poor.


