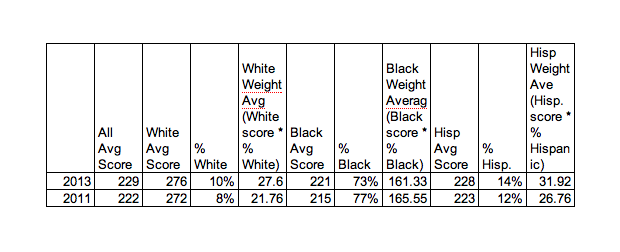
As I wrote on Nov. 7, 2103, Washington DC posted the one of the strongest test score gains in the nation on the 2013 National Assessment of Educational Progress and I wanted to look at how demographic shifts in the nation’s capital might be influencing these test results. I began by constructing this table.
Washington DC NAEP Test Results for Fourth Grade Mathematics
 Sources: Table A-12. Percentage distribution of fourth-grade public school students assessed in NAEP mathematics, by race/ethnicity, eligibility for free/reduced-price school lunch, and state/jurisdiction: 1992, 2003, and 2011
and
http://nationsreportcard.gov/reading_math_2013/#/state-gains
So my question is, what drove the 7 point increase in test scores? When you break the test scores down by ethnicity and weight them by their percentage of the student population, it’s interesting to see how both white and Hispanic test gains contributed more to the average score than black gains. True, black test scores increased by 6 points on average, but their share of the population is falling. Meanwhile, whites and Hispanics are growing populations in the city and their smaller test score gains are proportionally accounting for more.
I also found it interesting to see that the average White test score in the District is 276. That’s a very high number, surpassing the average white test score of Massachusetts by 16 points. I think that shows just how wealthy and highly educated the average white family is in Washington DC. But the whites of Northwest DC shouldn’t be too smug. Only 6 percent of the District’s students tested at or above the “advanced” threshold. In Massachusetts, 16 percent of the fourth graders are “advanced”.
As always, comments welcome.


