Fourth and eighth grade public school students in Washington DC and Tennessee showed huge gains on national math and reading tests in 2013 from two years ago, the last time the National Assessment of Education Progress (NAEP) exams were administered. Unusual seven point gains were seen on some tests, whose results were released on Nov. 7, 2013. By contrast, the nation’s public schools on average were flat or posted small one or two point gains in the same time period.
Still, Washington DC’s test scores remain the worst in the nation. It ranks dead last behind every state in the Union in 4th grade and 8th grade math and reading tests. Similarly, Tennessee is among the bottom half of the states, below the national average.
The National Center for Education Statistics (NCES) did not comment on what might have caused these outsized gains in Washington DC and Tennessee. I plan to look into how demographic changes and gentrification in the nation’s capital might be correlated.
National results
In assessing the national results, NCES Commissioner Jack Buckley said that that the small, incremental gains in math and reading “suggest that students are making progress.” Over time, small one and two point gains can add up to meaningful improvement. But he cautioned that not all students are making even these small, incremental gains. When you drill down to the nation’s bottom and top students by percentiles, you see that the bottom half of students aren’t making progress and that most of the gains are among our higher performing students. You can also see this inequality trend on a regional basis. For example, Massachusetts is still one of the top scoring states in the nation, but it showed a small decline in fourth grade reading. When you drill down into which students were scoring worse, it was the poor students who qualify for free or reduced price lunches. There was no slippage in scores among middle class or affluent children.
The way I would phrase it at a cocktail party would be like this: The richer are getting smarter. The poor are stagnating. Yet another sign of how growing income inequality in our country is affecting outcomes.
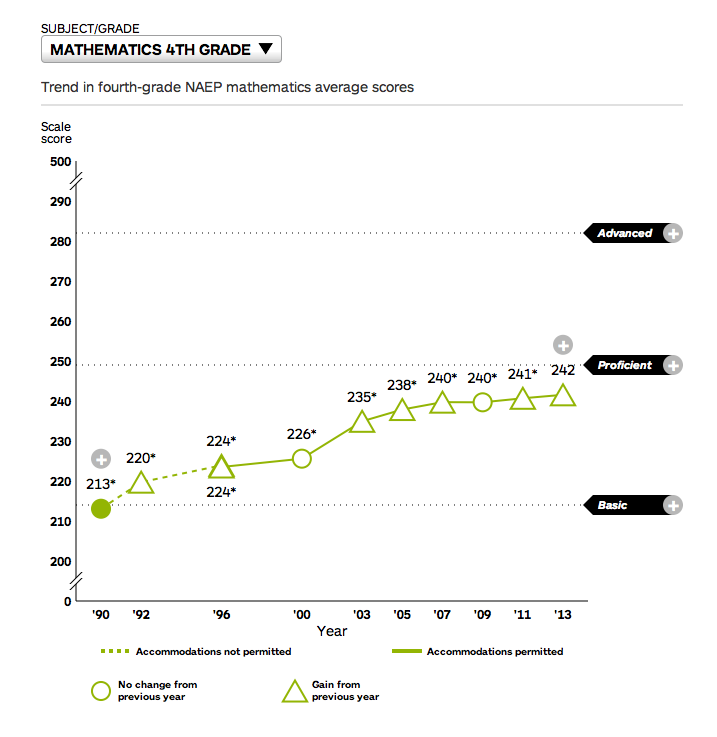
Historical Perspective. When you look back at how the nation’s scores have changed over the years (see chart), you see giant gains in math since 1990, especially for fourth graders. But scores seem to have stagnated since 2007. That’s because our bottom students used to be especially weak and educational policies in the 1990s specifically focused on raising the achievement level of our bottom students. But now that the national distribution of test scores is more normal, resembling a conventional bell curve, it is unlikely that we will see the kinds of huge gains we saw in the 1990s and early 2000s again, according to Commissioner Buckley.
Additional NAEP Coverage from Education Week .


