


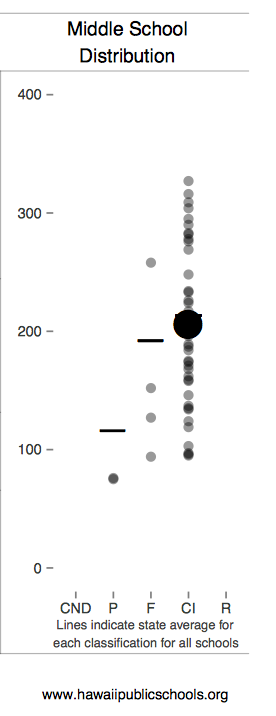
Example of a graphic on a Hawaii school report card
One of the many provisions of the 2001 federal education act, known as No Child Left Behind, was a requirement that states had to issue a “report card” for every public school. The report cards include things you might expect like student test scores and test score changes, but also a laundry list of data from graduation rates to school demographics.
Part of the purpose of making this data available was to help parents see how the students in their children’s school were faring and make more informed choices, whether it’s pressuring the school and district to do better, or taking their children elsewhere.
More than a decade later, much of this data remains inaccessible and inscrutable to parents — even to education experts.
To see the report cards in Florida, for example, you’d have to download Excel spreadsheets, or you can try clicking through a series of user unfriendly screens . In Hawaii, each school’s report includes a baffling distribution chart (see graphic on the right). There is a separate document, twice as long as the report card, that explains how to interpret all the figures and acronyms. Minnesota’s report cards disclose the number of students who are eligible for “celebration.” Of what, one might wonder, birthdays? Another state awarded an elementary school 17.29 points for an “average growth z score” without further explanation. The Education Commission of the States (ECS) issued a August 2014 report, “Rating States, Grading Schools” and concluded that too many report cards are hard to find and hard to understand.
Related story: NCLB co-author says he never anticipated federal law would force testing obsession
It’s a sad outcome because the parents who could take advantage of this data the most, where school improvement is most needed, tend to be from the most disadvantaged and disenfranchised communities. These report cards need to be easily digestible.
“There are smart statistical people good at cranking out data, but they are not known for design. What is good design for a policy wonk, is not a good design for a parents and policy officials,” said John Bailey, a former Bush White House official, who now wears several hats in the education policy world, including vice president at the Foundation for Excellence in Education. (The conservative organization, headed by former Florida Gov. Jeb Bush, supports the greater use of education technology, promotion of charter schools and measuring schools by student test performance.)
By coincidence, in June 2014, Bailey had just collaborated on a paper about the role of prizes and competitions in generating good ideas. And he was inspired by a health design challenge where visual graphic designers reimagined patient information records. “There’s all this very wonky complicated data that’s given to patients that doesn’t make a lot of sense. It’s the same in education,” he said.
So Bailey came up with the idea to use $35,000 of his organization’s money to launch an education data design competition. Ed Excellence has reached out to the design community both for contestants and for judges. The winner will be announced in December.

This article also appeared here.
It sounds like a fun fall project for a Rhode Island School of Design student. But it’ll be a tough challenge for even a seasoned graphics expert to put a school’s test scores in the context of its student demographics in an understandable way. If you just report straightforward test scores, schools with rich students will likely have higher scores than those with poor students. Showing how much students learn each year is better. But measuring academic growth is a complicated task and it’s hard to explain simply. Using regression analysis to adjust for poverty — even more complicated!
Hallmarks of good design are simplicity and minimalism. But state report cards are required to include lots of data. One of the problems mentioned in the ECS report are that parents are already overwhelmed by data. It cited one parent who complained that one report card was“[l]ike reading a corporate financial report of 20 pages.” Bailey hopes that designers will come up with a simple starting point, but give parents an intuitive way to dig deeper if they’re interested. “You don’t have to show all the proficiencies by subgroup on the same page,” Bailey suggested.
Some states and urban school districts have tried to improve their report cards. Washington, D.C. recently revamped its school report cards on its LearnDC website and they’re an inspiring model of simplistic design. Here’s an example. (Still, there are numbers that lack context. What’s that school classification score based on?) And New York City announced on Oct. 1, 2014 that it was revamping its school report cards. In addition to jettisoning simple letter grades for each school, the city is trying to make them parent friendly. Here’s a model example with fictitious numbers. It’s written in plain English, but way too wordy. And for a city that’s filled with brilliant designers, this document lacks inspiration, colors and graphics. Probably not a design competition winner.
Bailey says his ultimate goal is to raise the quality of discourse on education.”The more information that parents and policy makers have, the more informed the debate is going to be,” he said.
Useful report cards also won’t hurt the cause of data proponents, who’ve recently been burnt by the demise of national student data warehouse inBloom. If ordinary parents start to see data as something useful and not just a threat to their children’s privacy, perhaps the data geeks will have enough public support to be able to resurrect their dream of mining vast amounts of student data to improve education.
Related story: Big data and schools: Education nirvana or privacy nightmare?
